Full Report
Annual Learning Report 2021/2022
Full Report
Annual Learning Report 2021/2022
About This Report
This report is Lambeth Early Action Partnership’s (LEAP) first programme-level evaluation output. It summarises initial evidence of LEAP’s progress towards our intended impact of improving Early Child Development outcomes for children in our target areas.
The first in a series of annual reports on LEAP’s progress, it allows us to test the efficacy of LEAP’s Theory of Change, identify areas for reflection, further research, and potential programme improvements.
As the programme moves into its final years, annual reports like this one will be complemented by the other outputs of LEAP’s local evaluation. This will include both formative and summative evaluations delivered by an external research partner.
For more information about LEAP or this report, please contact leapevaluation@ncb.org.uk.
Message from Laura McFarlane, Director
I am delighted to introduce our first Annual Learning Report.
The findings contained in this report give us a real opportunity to develop a deeper understanding of our programme. The report shows how our services are supporting children and families to have a better start, whilst also giving us crucial insight into which families we are engaging and working with via our services.
There is much to celebrate in this report!
To date, LEAP services have worked with over 14,200 children and families. Many families rate LEAP services very highly and parents report feeling more knowledgeable and confident in supporting their child’s development.
We are on track to achieve our early goal of giving more than 10,000 children aged 0-3 in Lambeth a better start in life.
This report also offers food for thought. We are committed to continue learning from these emerging findings to further our understanding of the families in the LEAP area and how our services are received.
Many people are involved in bringing these insights together. From parents who complete questionnaires and feedback forms, to practitioners who regularly submit data. The LEAP Core Team have skilfully analysed and presented these findings, so we are able to share our learning. I would like to offer my thanks to all involved in this work.
I invite you to read the summary report for an overview of the findings and then dive deeper into this full report for detailed analysis of some of the outcome areas LEAP works on.
As we approach the final stages of the LEAP programme, I am confident that the insights and stories contained in this report will enable us to focus on areas for improvement and development as well as creating a strong evidence base for our local Lambeth system and beyond.
I hope you will find this report useful and inspirational.
Laura McFarlane
Director
1.0 Executive Summary

1.1 About LEAP
Lambeth Early Action Partnership (LEAP) is one of five local partnerships which make up A Better Start, a national ten-year (2015 – 2025) programme funded by The National Lottery Community Fund that aims to improve the life chances of babies, very young children, and families.
LEAP works with a wide range of children, families, practitioners, and organisations across Lambeth. We fund, improve, and evaluate over 20 local services, meeting the needs of families through pregnancy and the early stages of childhood.
Our aim is to:
- Improve early child development outcomes for all children living in the LEAP area
- Reduce local inequalities by supporting those at a greater risk of poor outcomes
LEAP delivers services in parts of Lambeth (the LEAP area) where young children experience greater inequalities than children in the rest of the borough.1 The LEAP area is home to almost a fifth of children under 4 in Lambeth.2 While LEAP has some targeted services that are only available to families living in the LEAP area, other services are available to all families living in Lambeth, and some are open to anyone who wants to attend.
Services fall into two groups:
- Services that work directly with children to help them reach their development milestones.
- Services that support children indirectly, by working with parents, early years practitioners, and the wider community, so they are better equipped to provide the responsive relationships and positive experiences that children need.
LEAP is a collective impact initiative, which means that all our services and activities link together and work towards shared goals to improve outcomes for young children.
1.2 About this research
This report presents emerging insights about our overall reach and the learning taken from our internal Shared Measurement System. It has been written by LEAP’s team of researchers and analysts.
We routinely collect and analyse data from across the programme. This helps us monitor performance across services, track progress towards outcomes, and continuously learn and improve. Data is stored in our innovative Integrated Data Platform. We have been collecting some data since the start of LEAP in 2015, including the number and demographics of people accessing our services. However, some feedback and outcomes data has only recently been collected as part of our Shared Measurement System (which started in 2021).
This report presents findings on the engagement with LEAP services across the complete programme portfolio. This report then shares findings from across the programme on four of our Theory of Change outcome domains: 1, 2, 3 and 6. These domains had the best data available at the time our analysis began in March 2022.
By analysing routine service data, LEAP intends to learn what works in early years, to improve both evidence and practice. These findings will be used internally by the LEAP team to drive learning and improvement. By sharing them publicly, we also seek to build external knowledge of the LEAP programme.
1.3 Reach & Engagement
Key findings
- Over the lifetime of the programme, LEAP services have reached over 14,200 children and families (6,966 children and 7,239 parents or carers).
- An additional 5,038 individuals have been reached through our lighter touch community engagement activities which include festivals and events curated by the LEAP community engagement team.
- Families engaging with LEAP services broadly reflect the ethnic diversity of the population, though anecdotally we know there are still some groups who are less likely to engage.
- 49% of families engaged in services live in the LEAP area. Another 42% live in other areas in Lambeth, while 9% live outside the borough.
- Mothers account for 87% of the parents and carers we engage, while fathers account for only 7%. The remaining 7% are made up of other carers such as other family members and childminders.
- The vast majority (85%) of children and families who engage with LEAP attend only one service, with 14% attending between two and four services.
- LEAP has provided capacity building support to 1,681 practitioners across the early years workforce.
Reflections on our engagement
It is encouraging to see that the LEAP programme is on track to achieving our goal of giving more than 10,000 children in Lambeth a better start in life. It is also encouraging that the ethnic background of families engaged with LEAP services broadly represent the demographics of the wider population, demonstrating the programme’s capacity to engage with families and to appeal to the full diversity of the area’s communities.
Fathers’ participation in LEAP services is limited. Whilst this is not unexpected given wider societal barriers to fathers’ involvement in the early years, we will continue to think about LEAP-specific barriers that might impede fathers from accessing services.3 4
We are also interested in speaking with families and practitioners to understand more about the reasons influencing some families to attend multiple services as this would give useful insight into pathways for parents and carers. We would also like to hear from families from the LEAP area who haven’t participated in any services at all.
1.4 Child Health & Development
To achieve improvements in child health and development, LEAP offers several universal and targeted services working directly with early years children and families. Services measure child outcomes using a series of different measurement tools to assess impact.
Specifically LEAP works with:
- Pregnant women to provide enhanced maternity care as well as specialist nutrition and wellbeing support to improve birth outcomes
- Babies and their caregivers to promote secure attachment
- Young children in Children’s Centres and childcare settings to improve communication and language development

Here, we present emerging findings from two of these services where the data is most complete.
LEAP’s Parent and Infant Relationship Service (PAIRS) one-to-one support, delivered by a specialist Parent-Infant team, aims to improve the relationship between a parent or caregiver and their baby or young child. Clinicians work directly with parents or carers and their infant, or with expectant parents before birth, to promote secure attachment and positive, sensitive, and responsive parenting. Data from 28 families shows an improvement in family relationships and a reduction in observable difficulties for infants after engagement with the service, as seen in Figure 2 below.

Further information about LEAP’s PAIRS One-to-One Service and the outcome measures we use to monitor change, can be found later in this report.
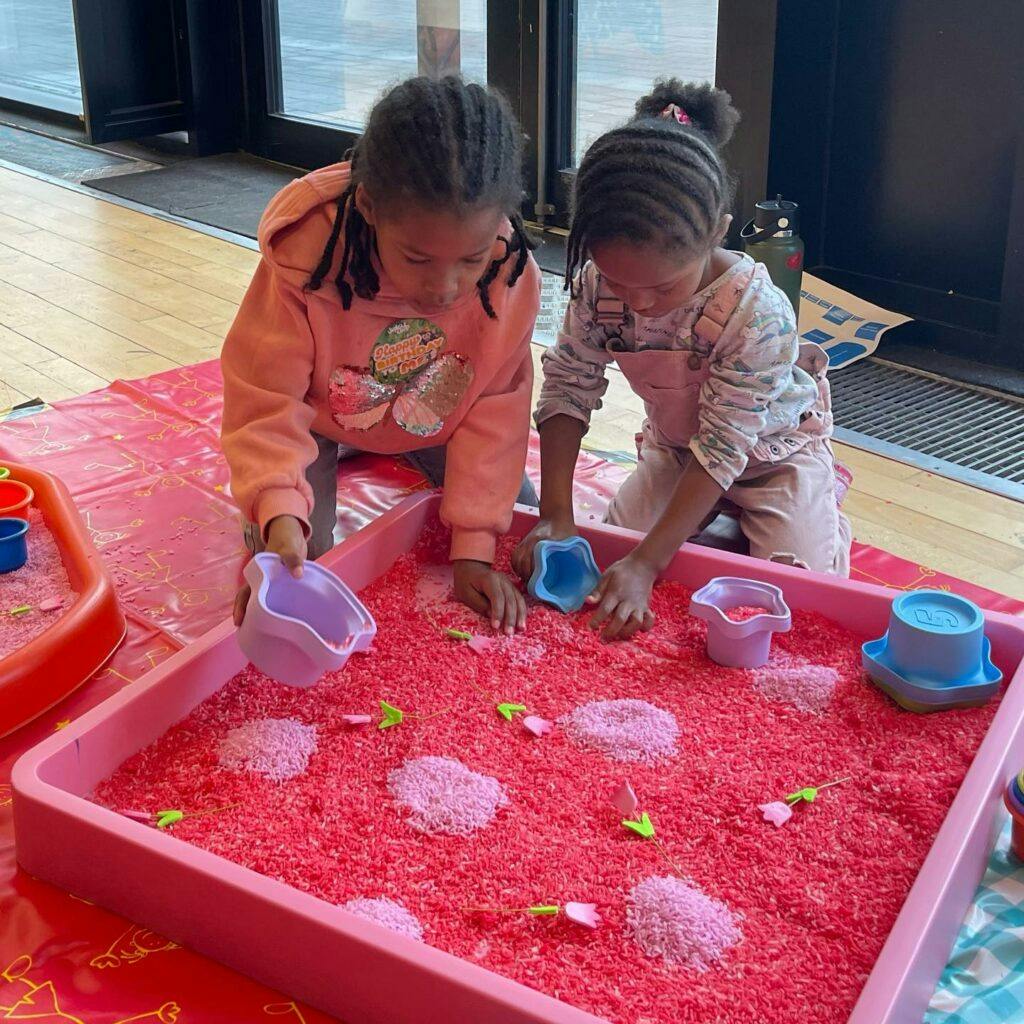
LEAP’s Natural Thinkers Service
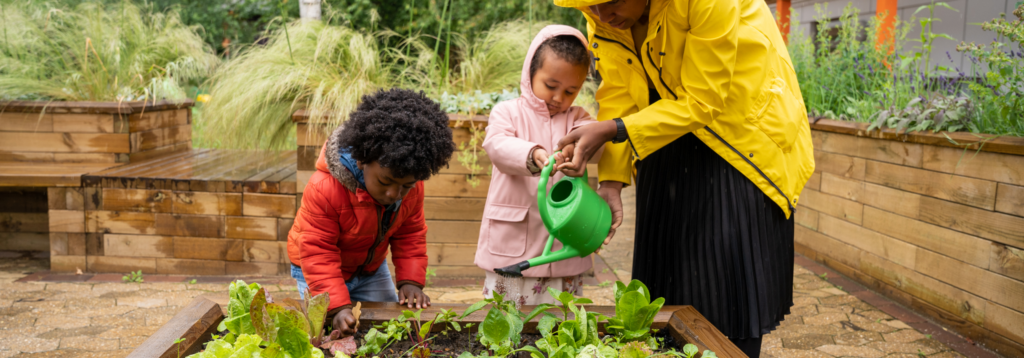
Children living in the LEAP area are less likely to have a private garden and good access to green space.5 Given this, LEAP delivers the Natural Thinkers programme which supports early years practitioners to provide high quality outdoor learning for children and more recently offers local ‘stay and play’ sessions for families. The aim of this service is to improve children’s wellbeing and their communication and language development.
It’s a highlight of our week as we live in a flat with no outside space & she has become confident exploring this session as if it were her own garden.
Looking for frogs and newts and actually finding them. Children absolutely loved hunting. Also, the hunt and find various insects and leaves with a tick-off sheet was so much fun too.
Data collected from 147 children, show children were more involved in activities and had improved wellbeing at the end of the service.
Boys had lower levels of involvement and wellbeing compared with girls at the initial assessment, but this gender gap had narrowed by the end of the programme, which suggests that Natural Thinkers activities may be particularly beneficial for boys.
1.5 Parental Health & Wellbeing
Having good physical and mental wellbeing is important in enabling parents to provide a positive, healthy, and stable home environment for children. By contrast, being in poor health or experiencing mental health issues can be a barrier to positive parenting6.
LEAP works with parents at the following stages:
- In pregnancy and postnatally
- In the early years through group sessions
LEAP also provides support to parents at risk of, and experiencing, domestic abuse during pregnancy or their child’s early years.
Here we present emerging findings from two of our services that work directly with parents and caregivers to improve their health and wellbeing.
LEAP’s Community Activity and Nutrition (CAN) service is a targeted programme that aims to support pregnant women in the LEAP area with a BMI of over 25 to adopt healthier diet and activity behaviours. It has a specific focus on engaging women from Black, Asian and minority ethnic backgrounds. 77% of women engaged by the CAN service are from these backgrounds.
Data from 485 women shows that CAN is helping all women to be more physically active by walking more during pregnancy. This increase in physical activity is continued postnatally (Figure 4). Women from Black, Asian and minority ethnic backgrounds have lower levels of physical activity when entering the service, a difference which is consistent with national surveys. This difference is seen both before and after participation in CAN.7

In future research, we hope to explore birthweight outcomes for CAN participants, linking these to physical activity data and participant characteristics. Find out more.
LEAP’s Enhanced Casework (Gaia) service offers holistic support to LEAP parents who are experiencing, or are at risk of, domestic abuse during pregnancy or their child’s early years. This includes emotional support and practical assistance with issues such as housing and legal matters.
By the end of engagement with the service, just over a third (36%) of clients said that they had experienced an end to all types of abuse and controlling behaviours. Abuse frequently continues for years after the end of a relationship, so this finding is not unexpected. It highlights the importance of signposting people to continued support. After engaging with the service, all clients said they now felt confident about accessing help and support relating to domestic abuse.
The Enhanced Casework team monitors changes in clients’ levels of psychological distress using the CORE-10 validated measure. Analysis of average scores shows a significant decrease in clients’ psychological distress from intake to the last session. At exit, no client had severe or moderately severe distress, compared with 22% of clients at intake (See Figure 5 below).

1.6 Parental knowledge, skills and behaviours
LEAP services aim to equip parents with the knowledge, skills, and behaviours they need to provide their very young children with the best start in life. Here we report on findings from services which focus on behaviours that we know have a positive impact on children’s long-term outcomes. These include positive parenting, the home learning environment, and breastfeeding.
Parenting and parent-infant relationship
- As a result of participating in the Baby Steps programme and/or the Circle of Security Parenting programme, parents feel more knowledgeable and confident about parenting, and enjoy being a parent more. Some parents, however, still felt low or moderate confidence about dealing with the stresses of being a parent. LEAP would be interested to explore this with families to understand if there is more we can do to support their confidence about managing these stresses.
- Parents taking part in LEAP’s Baby Steps programme developed a closer relationship with their unborn baby over the course of the programme (measured using the Prenatal Attachment Inventory).8 Though attachment does tend to increase throughout pregnancy9, it is encouraging that we observe a significant positive change among Baby Steps participants, as higher levels of prenatal attachment are associated with positive health behaviours in mothers and secure attachment in infants.10 11
- Pregnant women living in relatively less deprived areas, however, seem to have better attachment to their unborn babies than pregnant women living in more deprived areas. This difference is seen both before and after participation in Baby Steps. Risk factors for the development of prenatal attachment include poor maternal mental health, minimal social support and smoking during pregnancy. These factors can be more prevalent (seen more often) in mothers from less advantaged backgrounds.12 LEAP continues to try to better understand and address differences in prenatal attachment.
- A caregiver’s perception about their infant’s thoughts, feelings and intentions towards them plays a large part in how the caregiver behaves and interacts with their infant. This has consequences for the infant/child. Feelings of ‘warmth’ (e.g., ‘my baby smiles at me’) positively influence the development of the caregiver-infant relationship, while feelings of ‘invasion’ (e.g., ‘my baby wants too much attention’) can have a negative impact. Participation in Circle of Security Parenting seems to strengthen the relationship between parent and baby, significantly increasing feelings of warmth and decreasing feelings of invasion (measured using the Mothers Object Relations Scale).13
- Reflective functioning refers to a parent’s ability to think about their own and their child’s mental states (e.g. feelings, desires, wishes, goals and attitudes). This ability is an important steppingstone to other positive parenting behaviours, such as responsiveness, which helps the development of secure attachment and emotional regulation in children.14 Parents who engage in LEAP’s Parent and Infant Relationship One-to-One Service experience some improvements in reflective functioning (measured by the Parental Reflective Functioning Questionnaire (PRFQ).15
Home learning environments
- Two of LEAP’s communication and language development services, Sharing REAL and Supporting Babies’ Next Steps, are helping all parents to feel more knowledgeable and confident in supporting their children with early communication and language. This impact was most notable for parents with English as an additional language who overwhelmingly reported a very positive change in their knowledge and confidence. Approximately 40% of parents and carers that take part in LEAP’s communication and language development services speak English as an additional language. As children with English as an additional language are significantly less likely than their peers to have a good level of development at the end of reception year16, this may be an area in which LEAP is helping to reduce inequalities. LEAP will be working with our CLD services to better understand how and why LEAP’s CLD services may be particularly beneficial to parents with English as an additional language. Our aim will be to share this learning across the programme and beyond.
1.7 Practitioner skills and early years services
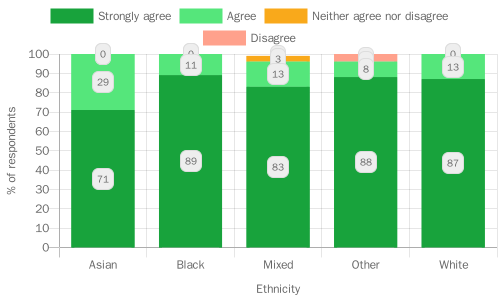
Feedback on LEAP overall is very positive, with families rating their experience of LEAP services very highly. Families say they find staff and volunteers to be welcoming, helpful and knowledgeable. Families trust LEAP staff and volunteers and feel that they understand their needs.
LEAP’s approach is underpinned by our work with communities and peer engagement. We’ve found that families are extremely likely to recommend LEAP services to their friends and family (based on LEAP’s overall recommendation score). This is true for all families, across all ethnic groups and for families living in relatively more and less deprived areas. Asian families, however, when compared with families from other ethnic backgrounds, were slightly less likely to strongly agree that overall, their experience of LEAP services had been positive. We don’t know why this is, but this is an area that might warrant further investigation.
We also found that families living in more socio-economically deprived areas of Lambeth and surrounding neighbourhoods were less likely to ‘strongly agree’ that they trust LEAP staff and learnt something new from LEAP services, compared with families living in relatively less deprived areas. This mirrors other studies that have found a link between families experiencing financial difficulties and levels of trust and engagement with support services, because of factors including daily stress and previous negative experiences of public institutions.17 18
LEAP also provides training and professional development opportunities to local practitioners to help support the provision of high-quality early years services. Practitioners rate LEAP’s support very highly, providing consistently positive feedback. Practitioners are highly likely to recommend LEAP’s workforce offers to their colleagues.
The facilitator was very warm, approachable, clear, patient with our questions and very helpful.
1.8 Conclusions
The findings presented in this report demonstrate the achievements and progress of LEAP services to date, both individually and collectively. In terms of overall reach and engagement, LEAP is steadily working towards achieving our initial target of engaging 10,000 children. LEAP is also demonstrating success in being able to engage families from diverse backgrounds, reflecting the overall LEAP population. This finding is extremely important in demonstrating our contribution to reducing inequalities at the population level. There are, however, some areas to explore about further improving our reach and engagement, particularly in terms of paternal involvement and pathways supporting parents and families to use multiple services.
Within the specific domains explored in this report, the changes in outcomes measured by validated tools are promising indications of the positive impact of the specific services. The PAIRS One-to-One Service is innovative in its approach. These initial indications of improved attachment could be very significant for services within Lambeth and beyond. Likewise, improved outcomes in pregnancy demonstrated by an increase in physical activity and improved parenting knowledge and practice also hold great promise. Better understanding of patterns of inequality in outcomes will be crucial moving forwards.
In this report it has not been possible to share outcomes across all services due to data availability, but LEAP continues to build our database of quality evidence through our Shared Measurement System. Future annual learning research will include larger and more complete data sets, covering all key domains of our theory of change, as well as additional child development outcomes data. Additionally, we intend to gain access to some key administrative data sets and to have linked data from Health Visiting and the National Child Measurement Programme data sets.
LEAP is also committed to continued learning and will invest in additional research activities outside of the routine monitoring data which is presented here. Specifically, LEAP will invest in detailed reviews of the services as well as a programme-wide evaluation to be conducted by our partner Dartington Service Design Lab. In addition, we will work closely with our partners in Lambeth and beyond to share and build on the early findings presented in this research. We will spread good practice and work together to address challenges and difficulties affecting our local populations, particularly in light of the current Cost of Living crisis.
2.0 Introduction to LEAP

Lambeth Early Action Partnership (LEAP) is one of five local partnerships which make up A Better Start (ABS).19 ABS is a national ten-year (2015-2025) programme funded by The National Lottery Community Fund which aims to improve the life chances of babies, very young, and families by changing the way services are commissioned and delivered.
LEAP is made up of parents, early years practitioners, Children’s Centres, the National Children’s Bureau, Lambeth Council, NHS trusts, community organisations and several local charities.
LEAP uses a place-based, collective impact approach to achieve our ultimate goals. This means that LEAP brings together people and organisations to share information and work in mutually reinforcing ways to contribute to the intended impact of:
- Improved Early Childhood Development outcomes for all LEAP children.
- Substantive improvement for those at greatest risk of poor outcomes.
2.1 LEAP’s approach
Evidence shows that early intervention can improve outcomes for children and families20, but there are limits to what single initiatives working in isolation can achieve21. This is because children’s lives are shaped by multi-level and interactive influences, including family, education and care, neighbourhood, and social and cultural contexts22 23 24.
As a place-based programme, LEAP aims to support children and families living in a select area of Lambeth (See Figure 7) by:
- Focusing on factors that influence child health and development and local causes of inequality;
- Creating a network of joined up, accessible services;
- Working in partnership with the local community; and
- Collecting data to learn what works.
A note on the LEAP area
Throughout this report we make reference to a number of geographic areas:
- LEAP – Most of the data included in this report was collected prior to ward boundary changes in 2022, therefore the LEAP area refers to four wards used prior to this change: – Coldharbour, Stockwell, Vassall, Tulse Hill
- Non-LEAP Lambeth – all Lambeth wards excluding the four LEAP wards noted above
- Non-LEAP other borough – boroughs other than Lambeth

2.2 LEAP’s Services
To achieve its intended impact, LEAP funds, continuously improves, and evaluates over 20 services in the LEAP area. These fall into two groups:
- Services that work directly with children to help them reach their developmental milestones;
- Services that support children indirectly, by working with parents, early years practitioners, other professionals, and the wider community.
LEAP services support families at every step through pregnancy and the early stages of a child’s life. As a collective impact initiative all of LEAP’s services and activities link together and work towards shared goals around improving children’s outcomes. LEAP works across three interrelated strands encompassing children’s:
- Diet and nutrition;
- Social and emotional development;
- Communication and language development.
More detail on LEAP’s current services can be found in Appendix 3.25
3.0 Aims & Objectives

This is the first in a series of annual evaluation reports which will look at LEAP’s progress towards our intended impact.
The foundations of LEAP’s evaluation are our programme and service-level Theories of Change (ToC) and a Shared Measurement System (SMS) which has been implemented over the last year. These reports will seek to test out LEAP’s Theory of Change, to see if the programme is working as intended. As LEAP moves into our final few years, these reports will complement and summarise the other outputs of LEAP’s local evaluation.
This first report explores LEAP’s new Shared Measurement System data, looking across our services at a programme-level to explore emerging insights about our impact.
At a programme-level, it has the following objectives:
- Assess the extent to which LEAP is reaching and engaging our target population.
- Summarise progress towards LEAP’s medium-term and long-term outcomes.
- Identify areas in which our Theory of Change is not working as intended and potential explanations for this.
3.1 How you can use this report
At LEAP, we want to share these emerging findings to stimulate discussion about what the data is telling us so far, about our approach to measuring collective impact, and about what we might want to do or change as a result of these findings. We hope this report will generate conversations that will inform our future evaluation outputs. To this end we invite you to share your thoughts, feedback and ideas with the LEAP Evaluation and Research team: leapevaluation@ncb.org.uk.
Beyond its immediate objectives, this report has a number of secondary aims:
- For the LEAP team and our partners:
- To build our knowledge of the LEAP programme and inform our understanding of the efficacy of LEAP’s programme-level Theory of Change.
- To demonstrate the scope of our data and the possibilities for analysis and learning.
- To celebrate the progress we have made towards achieving our outcomes and to identify areas for reflection, further research and potential programme improvements.
- For other interested organisations or individuals:
- To give an overview of LEAP’s work and our approach to evaluating a place based collective impact initiative including the limitations and opportunities presented by our Shared Measurement System.
- To present emerging evidence of changes resulting from our work: services making an impact on outcomes, and how the programme is working together as a collective.
- To connect with LEAPs evaluation work. This report is the first programme-level evaluation output, and we hope it provides a starting point for discussion and shared learning.
3.2 Background to this LEAP Annual Learning Report
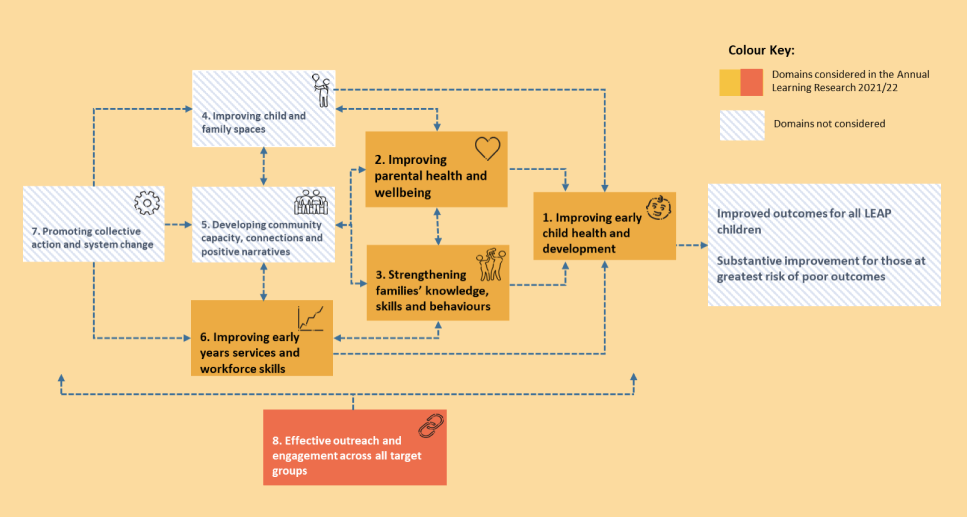
This report focuses on five of the eight domains or outcome areas from LEAP’s programme Theory of Change (See figure 8 for our Theory of Change with these domains highlighted). These are the five areas which at the time of writing this report, are best evidenced by the data we have collected so far.
What limitations are there to our data?
Throughout this report we try to make it clear where gaps in the data prevent us from answering certain questions or undermine the certainty of our conclusions. We also highlight areas we’ll be able to speak about with more certainty in future learning reports.
A key limitation is that our Shared Measurement System does not currently collect data on all eight LEAP domains. Some domains, such as ‘Promoting collective action and system change’, will require a distinct approach to measurement which will be developed with our local evaluation partner (Dartington).26
In addition, many findings presented in this report are preliminary results that will require further validation. While reach and engagement data has been collected over the lifetime of the project, several outcomes measures are new to services and families, and some services have not yet collected enough data for analysis. We have still listed services against outcomes included in this report, even if they haven’t been included in analysis yet, to show how LEAP is working across our intended outcomes.
Our ambition is that next year’s Annual Learning Report (2022/23) will address some of these gaps, by which point the Shared Measurement System will have been in operation for over a year and a much fuller data set will be available to enable a more rigorous exploration of the evidence.
3.3 What’s in the report?
Chapter 2 provides an introduction to LEAP and Chapter 4 gives an overview of how we are measuring our impact.
Chapter 5 (Domain 8 – Effective Outreach and Engagement Across All Target Groups) analyses the user and engagement data from across the programme to understand who is engaging with LEAP’s services and offers a breakdown of LEAP’s families by details such as ethnicity, age, and home language.
Chapter 6 (Domain 1- Improving Early Child Health and Development) provides a look at the long-term outcomes data LEAP has begun to collect on indicators of early child health and development including: obstetric outcomes, children’s diet and nutrition, children’s social and emotional development, and communication and language development.
Chapter 7 (Domain 2 – Improving Parental Health and Wellbeing and Positive Family Relationships) looks at medium- and long-term outcomes data around parental physical and mental wellbeing. It looks at LEAP families’ diet and physical activity levels, during pregnancy and after, parental mental wellbeing, and family relationships.
Chapter 8 (Domain 3- Strengthening Families’ Knowledge, Skills and Behaviours) considers medium- and long-term outcomes data to explore whether LEAP parents are developing the knowledge, skills and behaviours that children need to have the best start in life. This section includes data on positive, sensitive, and responsive parenting, and creating a positive home learning environment.
The final section of analysis in Chapter 9 (Domain 6 – Improving Early Years workforce Skills and Services) provides analysis of the feedback data collected from families participating in LEAP’s services, as well as practitioners participating in LEAP’s training and workforce development activities. This section looks at what people thought about the quality of LEAP’s services and their suggestions of what could be improved.
Chapter 10 reflects on some conclusions, implications and recommendations resulting from this work.
For an overview of the quantitative and qualitative research methods used for this report, see Appendix 4.
4.0 Measuring LEAP’s Impact

In the first five years of LEAP (2015-2020) we focused on establishing and developing services. In the second half (2021-2025) we are focusing on monitoring progress and evaluating the effectiveness and impact of LEAP as a programme.
LEAP has a three-layered approach to evaluation27 which consists of:
- The National Evaluation of A Better Start, overseen by a consortium of partners led by NatCen Social Research (NatCen).
- The Local Evaluation of LEAP, delivered by Dartington Service Design Lab, LEAP’s Local Evaluation partner.
- LEAP’s in-house Monitoring, Evaluation and Learning, led by our Evaluation and Research team. This learning report sits in this layer.28
Between 2019 – 2021, we worked with services, partners and families to refresh our service, domain and programme Theories of Change.29 These are our blueprint for LEAP’s evaluation. We also developed a Shared Measurement System.30
4.1 Theories of Change
The scope and ambition of LEAP means there are numerous possibilities for data that could be collected. To narrow the focus, and to ensure LEAP measures what matters the most, LEAP has adopted a Theory of Change (ToC) approach.
What is a Theory of Change?
An effective Theory of Change describes the activities an intervention intends to deliver and the changes, or outcomes, it expects to see in the short, medium, and long term as a result. It is a useful tool because it enables services to develop a set of key learning questions: the information they need to make sure delivery and impact are as good as they can be.
To capture the impact of LEAP’s individual services, and their collective impact as a programme, LEAP has developed Theories of Change at both the service and programme level. The overarching programme-level Theory of Change is divided into eight different but interconnected domains, these are:
- Improving early childhood health and development
- Strengthening Families skills knowledge and behaviour
- Improving parental wellbeing
- Improving child and family spaces
- Developing community capacity, connections, and positive narratives
- Improving early years services and workforce skills
- Promoting collective action and systems change
- Effective outreach and engagement across target groups
Each service’s Theory of Change corresponds to at least one of these domains. For example, Natural Thinkers works to improve early childhood health and development (domain 1) and to improve early years services and workforce skills (domain 6). For a closer look at LEAP’s domains and related work, see LEAP’s Interactive Theory of Change.31
4.2 LEAP’s Shared Measurement System
LEAP’s SMS enables us to explore how LEAP services are working together to achieve the programme outcomes. The SMS integrates data from across LEAP’s services and activities, and enables the LEAP team to monitor performance, compare performance across services, track progress towards outcomes, and identify opportunities for learning and improvement.
LEAP’s SMS includes:
- A common set of outcome measurement tools;
- Output indicators to support practitioners to monitor their delivery;
- Key Learning Questions across all services;
- Simplified data collection procedures to reduce the burden on practitioners;
- Additional data support for services to support accurate and robust collection of data; and
- An integrated data platform to support data reporting and analysis.
The key feature of LEAP’s SMS is a common set of outcome measurement tools. To inform the selection of tools, we commissioned an evidence review of effective measures, delivered by The Right To Know in 2021. The measurement tools were agreed using the evidence review and following discussions with subject-matter experts, families, service leads and key LEAP partners. The tools were selected to generate high-quality, robust evidence to be used in our evaluation.
To learn more about the development of LEAP’s SMS, and for the full set of measurement tools, see LEAP’s Practitioner Guide.30
4.3 LEAP’s Data Types
For each service, LEAP routinely collects six main types of data:
- Input data – the financial, human, and material resources used in planning and delivery.
- User data – the characteristics and demographics of the people accessing services.
- Engagement data – how many people engage with services and how often.
- Feedback data – what families and practitioners think of services.
- Medium-term outcomes data – the medium-term changes LEAP wants to achieve.
- Long-term outcomes data – the longer-term changes LEAP wants to achieve.
Input, user, engagement, and feedback data will enable us to understand whether services are:
- being delivered as planned;
- reaching their intended target population32; and
- of a good quality and are being rated well by families and practitioners.
Outcomes data will help determine:
- if and how LEAP has contributed to positive change for children, families, Early Years practitioners, professionals, and the wider community; and
- to what extent LEAP has contributed to reducing inequalities.
4.4 LEAP’s Data Integration Platform
The data collected through the SMS is stored on LEAP’s Data Integration Platform. The platform was developed to bring together pseudonymised data from across LEAP’s different services and enable a programme-level view.
The platform captures individuals’ journeys through LEAP’s services allowing LEAP to see the combination and sequencing of services accessed by families, and the effect of this engagement on outcomes. Hence, the platform is essential to evaluating the collective impact of the LEAP programme. To read more about the Data Integration Platform see Appendix 4.
4.5 LEAP’s in-house Monitoring, Evaluation and Learning
This Annual Learning Report forms part of LEAP’s in-house Monitoring, Evaluation and Learning. It builds on and complements the Quarterly Service Reports (QSRs)33 which have been developed over the past year.
The QSRs aim to support services to:
- answer questions related to their Theory of Change
- see how their service is performing and make improvements if needed; and
- better understand the families using their service.
5.0 Effective Outreach & Engagement Across Target Groups

Key Findings
- LEAP has reached a total of 14,205 individuals over our lifetime, including a diverse range of people of different ages, ethnic backgrounds and who speak different languages.
- Approximately 50% of those accessing or benefitting from the LEAP programme directly are children (6,966)
- 87% of children were below 4 years old at the time of registration, placing them in LEAP’s target cohort.
- 45% of children across all ages interacting with LEAP services are from the LEAP area, compared to 45% of parents and carers, and 44% of children aged 0-3.
- Mothers account for 87% of parents and carers accessing the LEAP programme, with only 7% of parents and carers being fathers.
- The ethnic diversity of individuals attending the programme is similar to that of the wider Lambeth population.
5.1 Why does outreach matter?
LEAP invests significantly in outreach and referral efforts for a number of reasons.
First, the more people who engage with LEAP services, the greater the positive impact the programme has on the community in our target areas. Reaching the right people is also essential to LEAP’s efforts to improve child development outcomes – not everyone would benefit equally from engaging with services. With this in mind, several services across the LEAP programme have eligibility criteria, specifying a target group for their programme, while some services are universal (open to all) (see Appendix 1).
All services also aim to reach and engage with individuals who come from disadvantaged backgrounds, and to encourage engagement across other services on offer at LEAP, where families are eligible.
5.2 Why do we collect data on who our services are reaching?
Collecting data on who accesses LEAP services allows us to understand whether services are achieving their aims to reach relevant groups in the local community.
Where possible, programme data is compared against population level data from relevant sources to identify gaps and understand more about the level of diversity across Lambeth.
Collecting data also allows us to understand more about the families LEAP services support, and to consider additional support that families may need. Ultimately, it helps to ensure services are developed and adapted to be as inclusive as possible.
5.3 How does LEAP collect outreach data?
When signing up to a service for the first time, families are asked to complete a short registration form which collects demographic information about children and parents or caregivers.
The data presented below summarises demographic information for children and adults accessing services across the programme between 16th October 2015 and 31st March 2022. It excludes data from the Family Partnership Model, Children’s Centres which were not part of the capital works programme, and community engagement activities. Four Children’s Centres are included for dates after 2020 Q1 due to the capital works programme. The use of a unique identifier from LEAP’s data platform means individuals are represented once in the demographic data below, although they may have accessed more than one service. For more detail on this, please see Appendix 4.
What should I consider when looking at demographic data?
Registration forms have been adapted over time to ensure services are collecting similar types of information, in a similar way where possible. This means some information which may not have been collected at the start of LEAP is now being collected.
In addition, although practitioners encourage full completion of registration forms, there are sometimes gaps in data. Validation rules set on LEAPs data integration platform aim to minimise inaccuracies due to data entry, however such inaccuracies are still possible. Due to gaps in data, numbers might not match up across fields (for example if an age is not recorded accurately for a child).
Data where attendance about an appointment has not been recorded or updated has not been included.
5.4 Who has accessed LEAP services?
LEAP has so far engaged over 14,200 individuals, including 6,966 children and 7,239 adults. These individuals are representative of the diversity within LEAP’s target area, including people from different ethnic backgrounds, countries of origin, and who speak different languages.
5.5 Access by family role
Table 1: Breakdown of individuals accessing services by their position in the family
| Participant’s Role | Number of Participants | Proportion of Participants | |
|---|---|---|---|
| Children | 0-3 years old | 6038 | 87% |
| 4-17 years old* | 768 | 11% | |
| Age unknown | 160 | 2% | |
| Total Children | 6966 | 100% | |
| Adults | Fathers | 483 | 7% |
| Mothers** | 6288 | 87% | |
| Other Primary Caregiver | 24 | <1% | |
| Other Family Member | 404 | 6% | |
| Other | 29 | <1% | |
| Childminder | 11 | <1% | |
| Total Adults | 7239 | 100% |
**Mothers are inclusive of pregnant women
Almost 50% of the individuals accessing the LEAP programme are children. Some services also provide data for children who are indirectly benefitting from the service and may be attending creche for the duration of the session. Of the children interacting with LEAP services, 83% were under the age of 4 at registration, and therefore within LEAP’s target cohort.
Mothers account for 87% of parents and carers while fathers account for only 7%. In some cases, parents and carers may be under the age of 18 but will be responsible for a young child accessing the programme, therefore will be included under parents and carers.
A note on family role terminology
Throughout this section we refer to individuals as ‘mothers’, ‘fathers’ and ‘pregnant women’. This reflects the options available on the most recent registration forms, which allow parents to select from ‘mother’, ‘father’ or ‘other primary carer’. Previous systems allowed for additional fields such as ‘Other family member’, ‘Other’ and ‘Childminder’, so for some sections these categories are also presented.
LEAP’s data collection system does not have a gender-neutral parent role and the registration form only includes ‘male’ and ‘female’ options. This is to maintain consistency throughout the programme and across services, but we recognise that these options may not capture the experiences of all our families. Services encourage inclusive approaches to gender, for example through sharing pronouns during introductions.
Why are so few fathers engaging with LEAP services?
The involvement of fathers in the early years is an important topic, both at LEAP and within the wider early years sector. There has been research on the benefits of engaging fathers during the early years, and about the importance of designing services to be inclusive for fathers, given that they are often under-represented.
Challenges engaging fathers in early years services include: a lack of consistency, with sessions aimed at dads usually being one offs, lack of representation on promotional materials and within the early years workforce, early years typically focussing on mothers, timings of sessions during weekdays, lack of substantial paternity leave, or understanding or shared parental leave. There is also a lack of spaces, WhatsApp and social network groups dedicated to fathers.
At LEAP, we ensure fathers’ voices are included and heard during community co-production sessions, and target recruitment for parent volunteer roles. We also try to increase engagement by organising dad’s sessions through our festival-model of engagement, ensuring dads are represented on promotional materials. We further enhance the local offer for dads by funding organisations that work with dads through the CoCreate fund.34
5.6 Access by area deprivation
The Index of Multiple Deprivation (IMD) measures relative levels of deprivation across England according to seven criteria (income, employment, health deprivation and disability, education, skills and training, crime, barriers to housing and services, and living environment).
Each neighbourhood (consisting of approximately 650 households)35 in England is given a score, then the neighbourhoods are all ranked. The final IMD score is based on this rank, and therefore reflects how deprived an area is relative to other areas. For the purposes of analysis we divide areas into five equal groups, with areas in group one being the most deprived, and areas in group five being the least deprived.
In 2019, 43% of neighbourhoods in the LEAP area were classified amongst the ‘most deprived’ 20% of neighbourhoods in England. LEAP also does not have any areas in the fourth or fifth groups (reflecting the relatively high levels of deprivation in the area).
Notably, in 2015 a significantly higher proportion of neighbourhoods in the LEAP area – 59% – were classified amongst the ‘most deprived’ 20% of neighbourhoods in England. However, as this is based on a relative ranking of neighbourhoods across England, this does not necessarily mean that the deprivation profile in the LEAP area has improved, but that it may have worsened to a greater extent in other areas across the country.
LEAP’s approach to measuring inequalities
LEAP’s intended impact of substantive improvement in outcomes for those children at greatest risk of poor outcomes articulates our commitment to reducing inequalities.
To measure inequalities LEAP tried to develop nuanced measures for Socioeconomic status (SES) indicators that were relevant to child outcomes. However, they proved challenging for services to collect routinely and didn’t feel directly relevant to services because the information being collected went beyond demographics.
In lieu of more nuanced indicators and given the poverty profile and diverse makeup of the local population, we have decided to focus on area deprivation and ethnicity as indicators for inequalities across outcomes and engagement data. We also look at language and country of origin although it is not a primary focus in this report.
5.7 Access by locality
Notably, significant proportions of certain groups (50% of children aged 0-3 and 48% of parents and carers) engaging with services are from outside LEAP’s target areas.
Table 2: Number of participants by locality
This includes families from outside of Lambeth. 1221 individuals engaging with LEAP services are from a borough other than Lambeth. Of those outside of Lambeth individuals are from neighbouring boroughs of Southwark (65%), Wandsworth (9%), and Lewisham (9%), and Croydon (8%). This could be due to the proximity of LEAP services in comparison to one’s home borough, particularly for those living near borders.
It is important to note that operational factors and changes made during the programme may also have influenced the number of families engaging with services who fall outside of the eligibility criteria. For example, some services extended their offer to non-LEAP families as they were starting up, or during periods of the COVID-19 pandemic.
| LEAP Area | Non-LEAP Lambeth | Non-LEAP Other Borough | Area Unknown | Total | |
|---|---|---|---|---|---|
| Children 0-3 | 2651 (44%) | 2537 (42%) | 536 (9%) | 314 (5%) | 6038 |
| Children 4+ | 463 (60%) | 238 (31%) | 39 (5%) | 28 (4%) | 666 |
| Parents and caregivers* | 3223 (45%) | 2905 (40%) | 627 (9%) | 447 (6%) | 7202 |
| Pregnant women | 1189 (83%) | 181 (12%) | 17 (1%) | 58 (4%) | 1443 |
Children’s location
44% of children aged 0-3 accessing the programme live in the LEAP area, and 60% of children aged 4 or above live in the LEAP area. Most children aged 0-17 (86%) accessing services are from Lambeth.
Pregnant women’s location
A total of 1,443 women were pregnant at some point during the time they accessed the LEAP programme, with 83% living in the LEAP area. This may be due to the eligibility criteria of services specifically supporting pregnant women. Pathways into maternity services means those services can contact all women who are booked for maternity care at Guys & St Thomas’ Hospitals (GSTT) or King’s College Hospital (KCH).
Parents and carer’s location
45% of parents and caregivers accessing the programme live in the LEAP area. 45% of mothers were from the LEAP area, and 4% of fathers were from the LEAP area.
5.8 Access by age
Data on age allows us to see the age at which children first register with the programme, and also the proportion of children over the age of 4 benefitting from the programme. We also collect the age of parents and carers to explore the average age and identify young families.
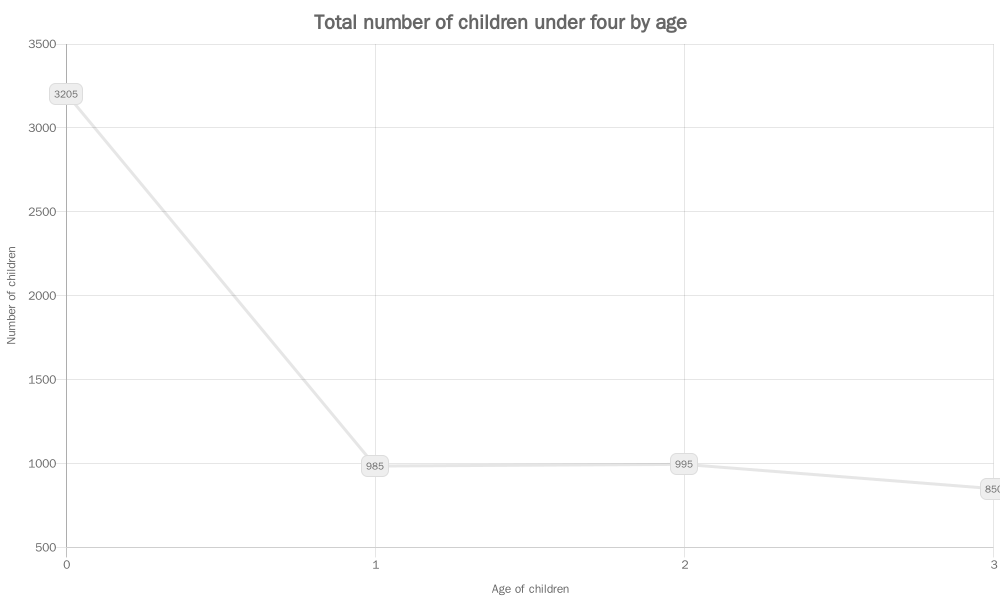
Children’s age
90% of children were between 0 and 3 years old at the time they registered with LEAP. Although the programme is aimed primarily at this age group, this may be explained by some services who have different age requirements or offer universal access. The Healthy Living Platform, for example, is open to families with at least one child under the age of 4.
Figure 9 shows the proportion of children at each single year of age who have engaged with the programme. The programme had a higher proportion of children aged 0 at their registration date, perhaps reflecting that women tend to join LEAP during pregnancy, or that decisions to return to work after maternity leave results in fewer opportunities to engage with LEAP when children are over the age of one.
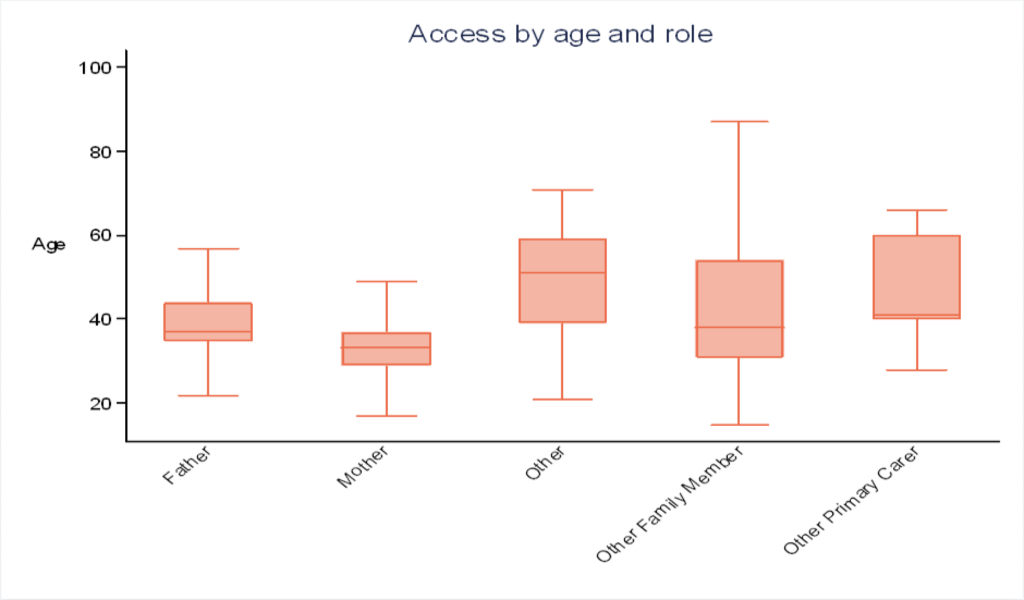
Parents and carers’ age
Ages for parents and carers engaging with the programme range between 13 and 102. The most common age group is 30 to 34 with 30% of parents or caregivers, followed by 35 to 39 with 29%.
1% of parents and carers are under the age of 17 at registration dates, with most of these (65%) living in the LEAP area.
Ages of mothers range from 14 to 55, while the average age of mothers attending is 33. Fewer than 1% of mothers engaging with the programme were under the age of 19 when starting the programme, which is broadly representative of the wider Lambeth population.
The most common age group for fathers is 35 to 39 at 31% and the average age of fathers is 37.
5.9 Access by ethnicity
By collecting data on ethnicity, we can explore whether there are differences in access, experiences and outcomes between different ethnic groups accessing our services. We can also make comparisons with ethnicity data on the wider population, allowing us to explore our reach. We can also consider, along with home language and Country of Birth, potential cultural practices, and ways to make service delivery as inclusive as possible.
The full ethnicity categories we use can be found on the example registration form in the appendices. This form is similar to the Lambeth children’s centre registration form36 and follows Office of National Statistics (ONS) guidelines where possible. When designing this form, one additional category (Black African – Somali) was added based on data available about who lives in the LEAP area.
Things to consider when looking at data on ethnicity
Ethnicity data is not always easy to collect. This may be due to families not wanting to share ethnicity data, particularly if they do not understand why data is being collected.
There may also be challenges with the way ethnicity is collected. Ethnicity is self-reported, and people may not always feel they fit into a box, or that ‘Other’ represents them well.
Figure 11 outlines the ethnicity breakdown of different groups engaging with LEAP services.
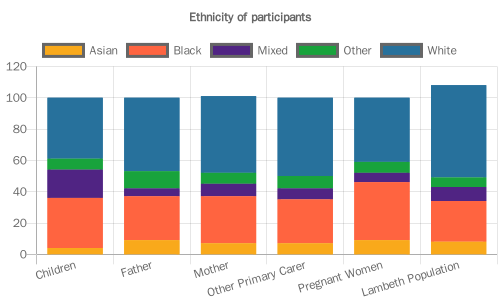
Children’s ethnicity
Ethnicity has been provided for 71% of children and is detailed in Figure 11. Of all the children engaging with the programme 40% are from a White background, followed by 31% from a Black background.
Pregnant women’s ethnicity
Figure 11 shows the ethnicity of women who have been pregnant at any point during their engagement with the LEAP programme. 90% of pregnant women provided their ethnicity while engaging with services. 41% of pregnant women are from a White background, and 43% are from a Black background. The breakdown of ethnicity is similar to the ethnicity breakdown of women accessing GSTT and KCH maternity booking service.37
Parents and carers’ ethnicity
Figure 11 shows the ethnicity of parents or carers. There is a higher proportion of adult family members from a White background, accounting for 38% of fathers, 49% of mothers and 50% of other family members.
The figure also includes ethnicity of the Lambeth population from the 2021 Census. Overall, the ethnicity profile of LEAP participants is comparable to that of the Lambeth population.
5.10 Access by sex and gender
All services collect data on individuals’ sex and gender. When collecting and referring to this information, for children we refer to sex, and adults we refer to gender.38
Limitations to data on adults’ gender
LEAP recognises that the current approach to collect data around sex and gender is not perfect or inclusive.
Though services aim to use inclusive language and be inclusive during service delivery, at present, registration forms only allow for individuals to select Male or Female when collecting data on gender. On top of this, though gender is not collected for some maternity services, it is currently a mandatory field on our integrated data platform, and as such is assumed to be ‘female’ for those engaging with maternity services.
Current developments within data systems at our partner NHS trusts (Guy’s and St Thomas’ and King’s College Hospital trusts) could allow for us to overcome this in the future by adapting the way data is collected for certain fields, allowing for more options.
Children’s sex
There is an even split between boys and girls accessing the programme overall, with 49% of all children under 18 recorded as female and 51% recorded as male. A similar split is observed when looking at the data for the LEAP area.
A lower proportion of boys compared to girls achieve expected levels of development at age 5, in the LEAP area, in Lambeth, and also at the national level.39 However, LEAP services that work directly with children do not specifically target boys because the services are implemented with all children in participating early years settings.
Parents and Carers’ gender
For parents and carers accessing LEAP services, 92% identify as female or are assumed to be female by maternity services who don’t collect data on gender, and 8% identify as male.
5.11 Special Educational Needs and Disability
LEAP aims to collect Special Educational Needs and Disability (SEND) information for children across the programme. This is particularly important to consider when exploring outcomes for children’s learning goals, and to ensure service delivery is as inclusive as possible.
Disability information has been recorded for 38% of parents and carers across the course of the programme, and for 60% of pregnant women.
Less than 1% of those who have disclosed their disability status have recorded ‘yes’ for both parents and carers, and pregnant women.
What should I consider when looking at SEND data?
Special Educational Needs and Disability data has not been collected consistently across the programme both over time, and across different services.
Additionally, although children are assessed against development goals as part of the Early Years Foundation Profile, the assessment process for a formal diagnosis can take several months. Data should therefore not necessarily be seen as presenting an accurate picture of service users.
5.12 Access by country of birth
Country of birth is collected as it helps to understand traditions and cultural practices, alongside ethnicity and language.
Children’s country of birth
Country of birth has been provided for approximately 56% of children. Out of those with a country stated, 94% of children were born in the United Kingdom. Appendix 7 shows the top four most common countries or areas of origin for children across the programme, accounting for 96% of children with a country noted.
Pregnant women’s country of origin
Country of origin has been provided for 79% of pregnant women, with 41% stating their country of origin is the United Kingdom. The remaining 59% are from other countries. The most common countries of origin are detailed in appendix 7. There are similarities between this data and the most common countries of origin reported from maternity booking data across GSTT and KCH37.
Parents and carers’ country of origin
50% of participants engaging in the programme have provided a country of origin. Out of those participants, 51% of parents and caregivers noted their country of origin as United Kingdom. The most common categories following the United Kingdom are Any Other Country (unspecified) accounting for 6% and Nigeria, Other African Country and Portugal, all accounting for 3% of parents and carers each. The most common countries of origin are set out in Appendix 6.
5.13 Access by home language
An individual’s home language is defined as the primary language that they speak at home with their family. Collecting home language allows us to understand potential translation needs, and the best way we can get our messages across to families.
What should I consider when looking at data on children’s home language?
There are gaps in home language data collected, with a language recorded for 52% of participants. The way data is currently collected on home language – by asking an individual to supply only one language – also means that we often have a limited understanding of their overall language capability.
For example, knowing an individual’s primary home language does not tell us whether they also have a good level of proficiency in English, so may not always be a useful indicator for whether they have translation needs. Similarly, it does not tell us if they have proficiency in languages other than English.
Languages with small numbers have also not been included in the tables. It is important to note the range of languages spoken goes beyond those listed, and families speaking these languages may not have regular access to translated materials of information should they need it.
Children’s home language
Home language has been provided for approximately 48% of children. Out of those with a language stated, 68% of children have a home language of English, and 32% speak a language other than English at home. Table 3 shows the most common home languages for children, across the programme.
Table 4 shows the most common languages for pregnant women where a language was recorded. Across the programme, 30% of pregnant women have speak a language other than English at home.
A similar observation is found in parents and carers. Table 5 shows the most common home languages for parents and carers, with 69% of parents and carers who provided language data speaking English at home, meaning 31% have English as an additional language.
Table 3: Most common home languages for children
| Home Language | Number of Children | Proportion of Children |
|---|---|---|
| English | 2,268 | 69% |
| Spanish | 174 | 5% |
| Other | 143 | 4% |
| Portuguese | 132 | 4% |
| Arabic | 105 | 3% |
| French | 83 | 3% |
| Somali | 56 | 2% |
Table 4: Most common languages for pregnant women
| Home Language | Number of Children | Proportion of Children |
|---|---|---|
| English | 850 | 70% |
| Spanish | 77 | 6% |
| Portuguese | 54 | 5% |
| Other | 53 | 4% |
| French | 26 | 2% |
Table 5: Most common languages for Parents and Carers
| Home Language | Number of Children | Proportion of Children |
|---|---|---|
| English | 2,835 | 69% |
| Spanish | 249 | 6% |
| Other | 177 | 4% |
| Portuguese | 151 | 4% |
| Arabic | 110 | 3% |
| French | 103 | 2% |
| Somali | 62 | 2% |
Next steps for evaluation and learning of our engagement:
- To explore the efficacy of efforts to engage more dads.
- To explore completeness for different fields e.g. home language, and reasons for different levels of completion.
- Find more ways to explore inequalities within the LEAP SMS data set.
5.14 Attendance at LEAP Services
Key findings
- During the programme, the number of session attendances has increased overall.
- The range of services accessed is one to 11 services.
- 84% of individuals have accessed one service.
- 15% of individuals have accessed between two and four services.
- 1% of individuals have accessed more than four services across the LEAP programme.
- Although the COVID-19 pandemic saw a decrease in attendance, services were able to adapt where they could and there was an increase in virtual delivery.
5.15 How many sessions have individuals attended?
Engagement data is analysed by the total number of attendances; therefore, individuals may be represented more than once across services and the programme.
There has been a total of 63,113 attendances at individual sessions and 87,865 at group sessions across the LEAP programme.
The COVID-19 pandemic and subsequent lockdown and social distancing rules created a challenge for services to be delivered as expected, and adaptations were made across the programme where possible. Some activities were paused and then later resumed, some transitioned to a virtual delivery format, and in some cases LEAP sought to enhance or add to existing services; for example developing website activities.40
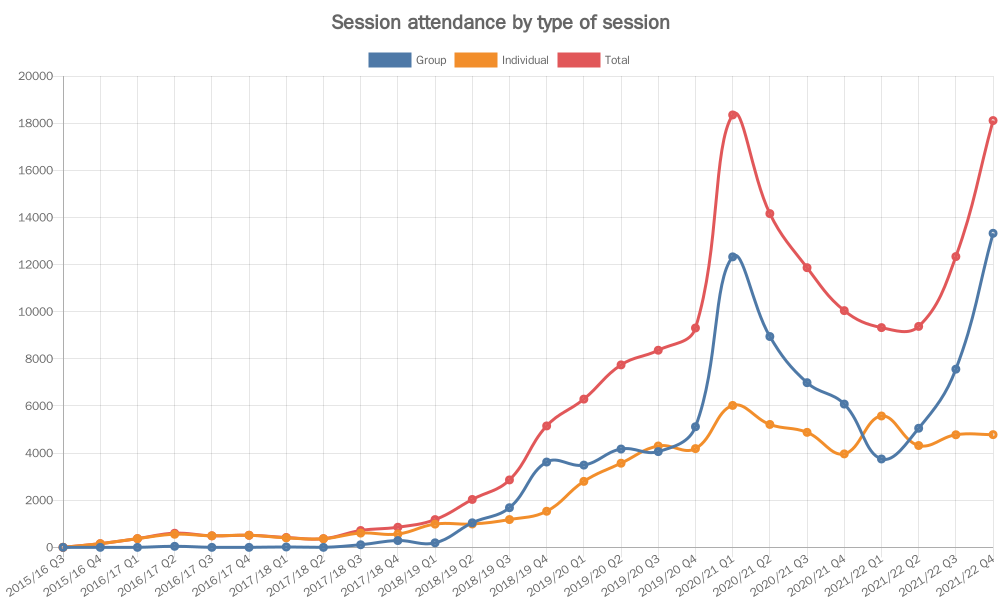
5.16 Group versus individual sessions
Figure 12 shows the number of group sessions, individual sessions and total number of sessions attended each quarter. There was a decrease in the number of attendances during 2019/20 Q4, reflecting the period of the first COVID-19 lockdown.
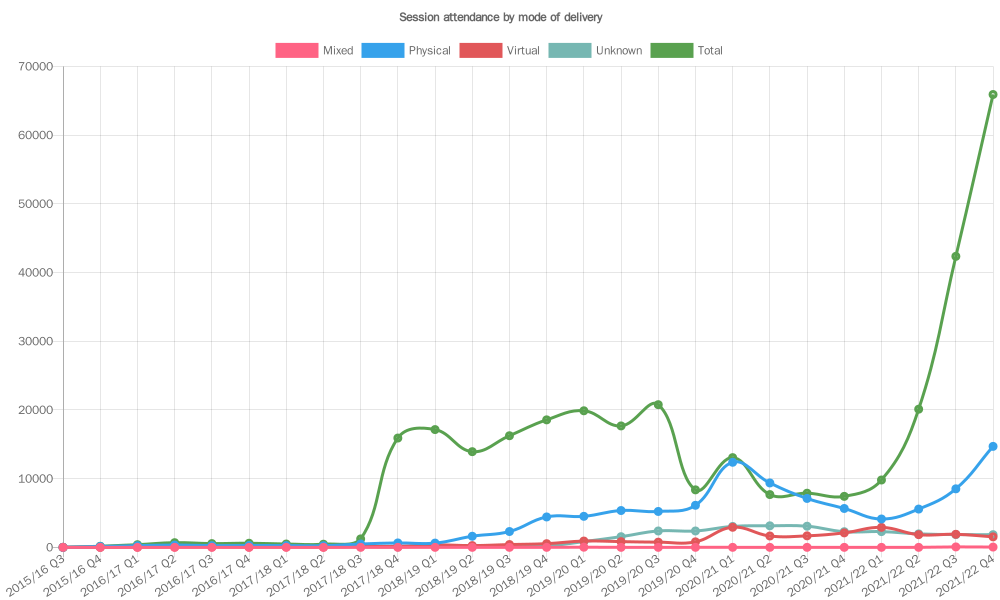
5.17 Online versus face-to-face sessions
64% of attendances were at sessions delivered face-to-face, while 16% of session attendances were virtual. Although some appointments were completed virtually prior to the COVID-19 pandemic, the number of virtual session attendances increased during quarter 1 of 2020/21 (April 2020 – June 2020) following the first lockdown of the pandemic (Figure 13). The following quarters saw a reduced number of attendances compared to pre-pandemic levels, but attendance increased again during quarter 2 of 2021/22 (July 2021 – September 2021).
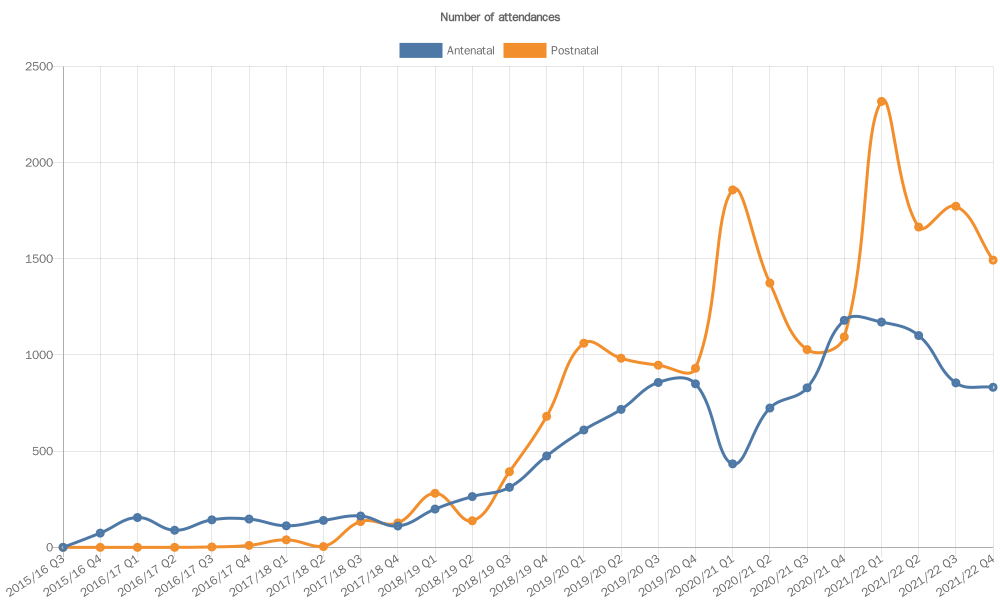
5.18 Antenatal vs Postnatal sessions
Figure 14 shows the number of attendances broken down by whether services are aimed at antenatal support. This allows us to see how the engagement of pregnant women and new parents has changed over time. In the early stages of the programme, there was a higher number of attendances for antenatal delivery, compared to postnatal. Quarter 3 of 2018/19 saw a shift, with a higher proportion of attendances for postnatal sessions. The number of individuals attending postnatal sessions began to increase in 2017/18 Q3, while attendance of antenatal services began increasing earlier in the programme (2016/17 Q1).
There was a drop in attendance at antenatal services during the start of the COVID-19 pandemic – 2021/21 Q1, but this began to increase again in the following quarter. In contrast, there was an increase in attendances at postnatal services during the start of the pandemic, but this dropped during 2020/21 Q2 before increasing again during 2020/21 Q4, suggesting there was still a need for support postnatally during the early stages of the pandemic. During the early stages of COVID-19, NHS staff delivering some services were redeployed, which influenced the number of sessions available for women antenatally. Additionally, there was limited evidence around the effects of COVID-19 on pregnant women and risks were unknown.
Next steps for evaluation and learning of our attendance:
- Explore trends in group session attendance.
- Explore reasons for different patterns of service attendance and why 80% of LEAP participants only attend one service.
6.0 Improving Early Child Health & Development
At the centre of LEAP’s Theory of Change are the outcomes that LEAP wants to achieve with children directly. LEAP aims to improve outcomes for children in three key areas: diet and nutrition; social and emotional development; and communication and language development.
6.1 Challenges in collecting early child health and development outcomes
Collecting outcomes for children in infancy and early childhood can be challenging. While diet and nutrition outcomes such as weight or dental caries can be physically measured, measuring communication and language, or social and emotional development, is more difficult. Infants and very young children may not be able to easily communicate their thoughts and feelings, and so outcomes must be observed or reported by someone who knows the child well.
Some LEAP services measure outcomes for children, and in this report we present data from PAIRS and Natural Thinkers on children’s social and emotional development. In future reporting we will also be able to present data on communication and language outcomes. Population-level indicators measured for all children in Lambeth provide another very useful source of information on LEAP children’s outcomes.
To date we have monitored these indicators to provide important context. Analysis of how these indicators have changed over time will be an important feature of LEAP’s summative evaluation work. In this report, we present some descriptive statistics on relevant indicators.
6.2 Population-level data on children’s outcomes
Several child outcome indicators are monitored at a population level, capturing data for both the LEAP area and across Lambeth. The indicators presented in Table 6 are monitored in line with some of the key childhood development outcomes we focus on. The indicators presented are generated using data from the most recent year available.
Using population-level outcome indicators
The LEAP area was selected based on local need, drawing on local sources of evidence including a set of population-level indicators spanning demographics, the wider determinants of health and each of the A Better Start outcome areas.41 The LEAP team continues to monitor and analyse many of these indicators to understand the ongoing context in which the programme operates.
Additionally, population-level outcome indicators can provide insight into the potential impact of LEAP services on the outcomes of a population, where service-level outcomes in a given area are unavailable or still in development.
While population-level outcome indicators are a valuable source of information and offer an alternative data source in lieu of direct participant data, there are limitations to using these indicators as proxy measures for service-level outcomes:
- We cannot identify LEAP participants within the wider population at this stage.
- Population-level outcome indicators may be more sensitive to detecting the impact of LEAP services with wider or more universal reach compared with more targeted services with very specific criteria which reach a smaller proportion of the population.
Children living in the LEAP area have poorer diet and nutrition outcomes compared to children in the rest of Lambeth
Being born with either low birth weight (Defined as a birth weight below 2,500 grams) or high birth weight (Defined as a birth weight above 4,000 grams) is associated with poorer outcomes. Low birth weight is associated with an increased risk of infant mortality, developmental problems and poorer health later in life.42 A high birth weight is associated with an increased risk of obesity, heart disease, and cancers later in life.43 44 45
Childhood obesity is associated with a higher chance of obesity, premature death, and disability in adulthood. During childhood, children with a higher BMI are also more likely to have breathing difficulties, hypertension, insulin resistance, and fractures.46 Tooth decay causes pain, infection, lack of sleep and time off school. In extreme cases children must have teeth extracted in hospital.47
Table 6: Population indicators of children’s diet and nutrition
| Indicator | LEAP Area | Lambeth |
|---|---|---|
| Rate of babies born with a high birth weight (2021) | 99 per 1,000 deliveries | 96 per 1,000 deliveries |
| Rate of babies born with a low birth weight (2021) | 42 per 1,000 deliveries | 36 per 1,000 deliveries |
| Percentage of overweight and obese at school entry (2020) | 26% | 23% |
| Percentage of overweight and obese at age 11 (2020) | 42% | 37% |
| Rate of hospital admissions for dental extractions in under 5s (2020) | 386 per 100,000 | 244 per 100,000 |
For all outcomes relating to diet and nutrition, LEAP children have poorer outcomes compared to Lambeth.48 49 50 For further comparisons and more data see LEAP’s data dashboard.51
Children in Lambeth are less likely to meet the expected level of development than nationally.
The Early Years Foundation Stage Profile (EYFSP)52 is used to assess the development of pupils in reception, measuring both personal, social, and emotional development, and communication and language development. Both are monitored for children living across Lambeth. National data are not available for 2019 but comparing data from 2018 shows that a smaller proportion of children from the LEAP area and across Lambeth achieved at least the expected levels of personal, social, and emotional and communication and language development compared with the England average.53 51
| Indicator | LEAP (2019) | Lambeth (2019) | England (2018) |
|---|---|---|---|
| Percentage of 5-year-olds reaching at least expected level of communication and language development | 80% | 80% | 82% |
| Percentage of 5-year-olds reaching at least expected level of personal, social, and emotional development | 82% | 83% | 85% |
6.3 LEAP services targeting child level outcomes
Improved obstetric outcomes, including mode of birth and reduction in preterm delivery and stillbirth (Caseload Midwifery)
Improved diet and nutrition including reduced incidence of high or low birthweight, reduced incidence of high or low BMI, and fewer children with dental caries / decay (HLP, CAN, Oral Health)
Improved social and emotional development including age-appropriate self-management and self-control, secure attachment to a trusted caregiver, child mental health and wellbeing, and positive relationships (PAIRS)
Improved communication and language development including age-appropriate use of verbal and non-verbal communication, age-appropriate vocabulary comprehension, and listening and attention skills (Natural Thinkers, Speech and Language Therapy, Making it REAL, Sharing REAL With Parents and Supporting Babies’ Next Steps)
Further detail on the measurement tools being used to measure child-level outcomes can be found in the appendices or LEAP’s Practitioner Guide.30
6.4 Improved social and emotional development
Key findings: Improved personal social and emotional development
- Fewer children have observed difficulties with day-to-day activities after their families have attended the PAIRS One-to-One service.
- After receiving one-to-one support, family relationships improve and no families have disordered/dangerous relationships between parents and their infant or young child.
Parent-child relationships improve and children have fewer observed difficulties with day-to-day activities after receiving support from PAIRS One-to-One Service
The PAIRS One-to-One Service uses elements of the DC:0–5™ Diagnostic Classification of Mental Health and Developmental Disorders of Infancy and Early Childhood (DC:0-5)54 to recognise mental health and developmental challenges in infants and young children and to monitor changes over the course of families’ attendance at the service (The full questionnaire contains six questions, but the PAIRS team only collect data for questions one, two and six).
The PAIRS clinician completes a questionnaire every 10th session, or every 3 months, depending on which occurs first, based on their observations of the family.
| Tool used | Timeframe | Sample size |
|---|---|---|
| DC:0-5 questionnaire | July 2017 – Jan 2022 | PAIRS One-to-One: 28 55 |
The DC:0–5 defines ‘relationship-specific disorders of early childhood’. A relationship-specific disorder is determined when ‘the infant/child exhibits a persistent emotional or behavioural disturbance in the context of one particular relationship with a caregiver’.56 PAIRS clinicians use these criteria to identify and record observable difficulties in each infant.
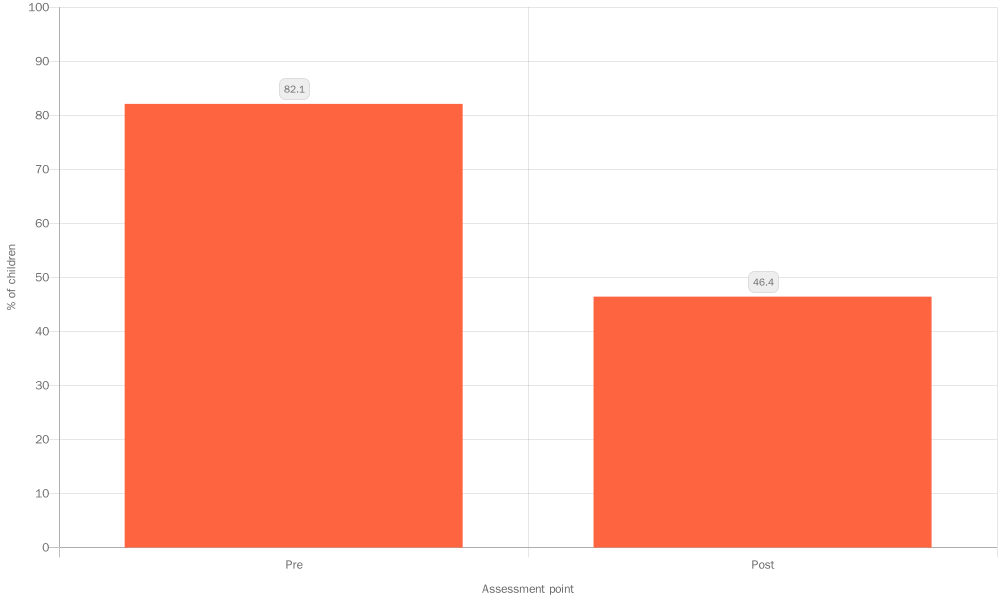
Observable difficulties were reported for 82% of children start of the service, reducing to 46% of children at the last assessment recorded for them, suggesting that engagement with PAIRS One-to-One has improved behaviour57.
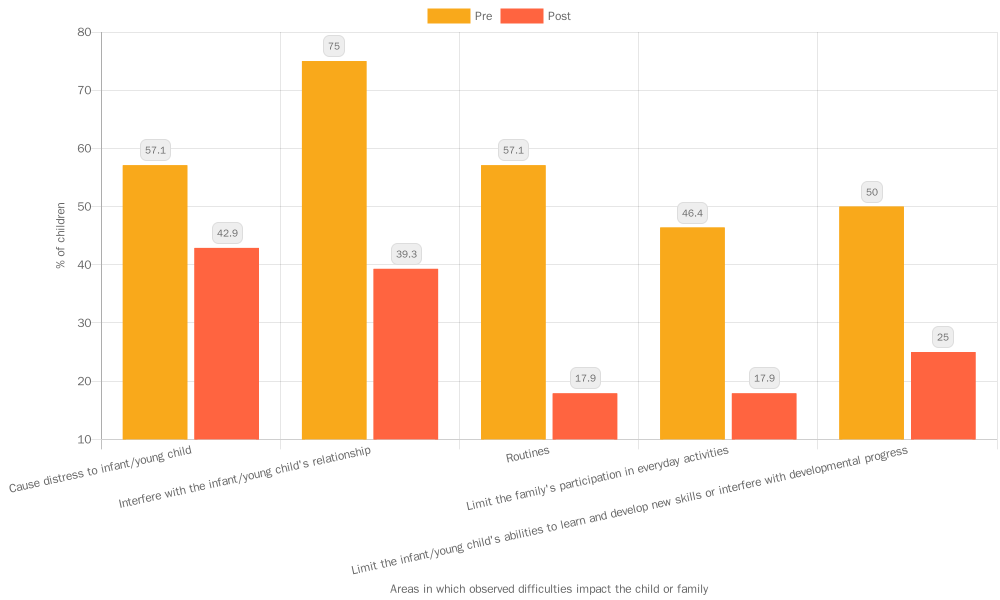
Clinicians also report how these difficulties impact the child or family (Figure 16). Before receiving support, three-quarters of children had difficulties impacting their relationships, and more than half had difficulties causing them distress or negatively impacting family routines. After receiving support, children were less likely to be experiencing difficulties across all areas. The impact on family life day-to-day was much lower, though clinicians still observed distressing difficulties for 43% of children.
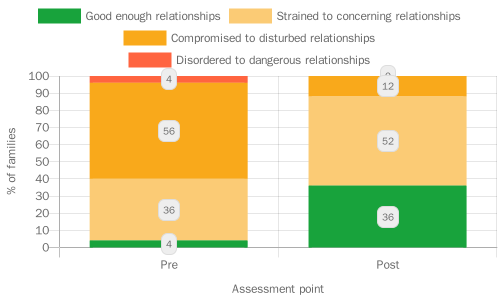
Clinicians also assess the overall level of relationship functioning between a child and their parent using the DC:0–5 ‘levels of adaptive functioning’ scale which takes into account aspects of caregiving and the child’s contribution to the relationship. The relationship can be categorised in terms of four levels of adaptive functioning. Level 1 is ‘good enough’ relationships that are not of clinical concern, level 2 is ‘strained to concerning’ relationships, level 3 is ‘compromised to disturbed’, and level 4 is ‘disordered to dangerous’ relationships. The proportion of families with ‘good enough’ relationships increased from just 4% to 36% (Figure 17). After receiving support from the service, no families had disordered/dangerous relationships.
6.5 Improved child mental health and wellbeing
Key findings: Improved child mental health and wellbeing
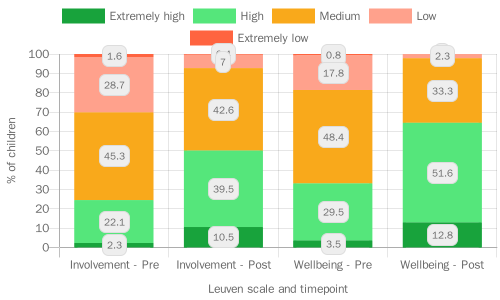
After taking part in the Natural Thinkers programme, children had higher levels of wellbeing and were more engaged in activities in their early years setting.
| Tool used | Timeframe | Sample Size |
|---|---|---|
| Leuven Scale | November 2021 – July 2022 | 147 children 58 |
Practitioners in Natural Thinkers settings use the Leuven tool59 to observe and record children in their settings. The Leuven tool focusses on two indicators: wellbeing and involvement. It is a 5-point scale ranging from extremely low to extremely high. The wellbeing indicator measures the emotional wellbeing of children. The involvement indicator measures the engagement levels of children in particular tasks.
Children in Natural Thinkers settings had better levels of engagement with activities at the end of the academic year compared to the beginning
Around a third (31%) of children were rated as having extremely low or low levels of engagement on their first assessment, compared with 7% at their last assessment. There was an increase in the proportion of children who were rated as having high or extremely high levels of involvement from 24% at their first assessment to 50% at their last assessment (Figure 24). This shows that children are better able to engage with activities at the end of the year.
Children’s wellbeing increases over the course of a year in a Natural Thinkers setting
A total of 19% of children were rated as having extremely low or low levels of wellbeing on their first assessment, compared with 2% at their last assessment. There was an increase in the proportion of children who were rated as having high or extremely high levels of wellbeing from 31% at their first assessment to 65% at their most recent assessment, showing children’s wellbeing increases over the course of the year in a Natural Thinkers setting (Figure 18).

Boys had lower levels of engagement compared to girls but the difference had reduced by the end of the year
Boys had lower levels of engagement at the start of the year compared to girls, but there was no significant difference at the end of the year60. There is some evidence that boys also had lower wellbeing than girls, and again this difference appears to reduce over the course of the year61. The practical, outdoor nature of Natural Thinkers activities may be particularly beneficial for boys, enabling them to ‘close the gap’ with girls in terms of engagement in activities.
Early child health and development: Next steps in evaluation and learning
Future reports will include further data from our Shared Measurement System, including evidence on communication and language development for children accessing SaLT Evelina and Chattertime
We will be obtaining more population outcomes including National Child Measurement Programme and Ages and Stages Questionnaire (ASQ) data. We will be linking these to children accessing LEAP programmes to demonstrate impact as part of our summative evaluation work.
The National Evaluation of A Better Start will be looking at child outcomes as part of a quasi-experimental analysis.
6.6 Case Study – Natural Thinkers’ impact on children’s wellbeing: “It’s the highlight of our week”
Playing outdoors is beneficial for children’s physical health, emotional wellbeing, and their communication and language development. LEAP children are less likely to have a private garden and tend to have less accessible green space nearby. In addition, parents and early years practitioners may not be aware of the benefits of outdoor play and may lack the confidence or time to take children to play outdoors.
LEAP therefore commissioned Natural Thinkers to increase LEAP children’s access to nature and to improve the activities they engage in outdoors. The main programme provides training, resources, and support to early years practitioners so that they can provide high-quality outdoor learning for the children in their settings. More recently, the service has started ‘stay and play sessions’ for families at children’s centres and community settings, providing different outdoor activities and ideas for playing in nature.
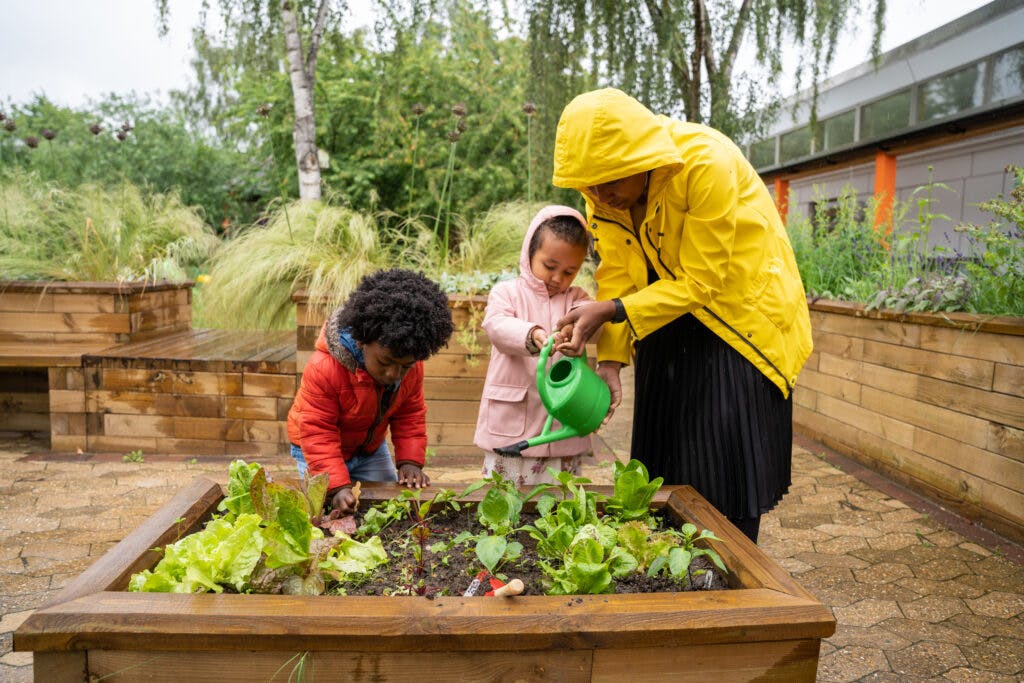
It’s a highlight of our week as we live in a flat with no outside space & she has become confident exploring this session as if it were her own garden.
Families rate the Natural Thinkers sessions highly, of 60 families providing feedback on the service:
- 100% felt welcome (6.6% agree, 93.3% strongly agree)
- 90% felt they learnt something new because of the service (68.3% strongly agree, 21.67% agree)
- 100% of parents felt their children enjoy the sessions, (90% strongly agree, 10% agree)
- Families’ average recommendation score for the service was 9.862
LEAP’s existing outcomes data suggests that participation in Natural Thinkers has a positive impact on Children’s wellbeing and involvement with average scores from the Leuven tool increasing between children’s first and last assessment.
Practitioners rate the Natural Thinkers training highly, of 33 practitioners providing feedback:
- 100% felt that the training met the objectives (88% strongly agree, 12% agree)
- 100% felt they learnt something new because of attending the training (88% strongly agree, 12% agree)
- 100% planned to try some of the ideas shared in the training
Practitioners commented that the most useful aspects of the training were learning about the Leuven scale and practical activities and ideas to use in their own settings.
Looking for frogs and newts and actually finding them. Children absolutely loved hunting. Also the hunt and find various insects and leaves with a tick off list sheet was so much fun too.
Natural Thinkers continues to be developed as a sustainable programme, embedding best practice in Early Years settings. It is delivered termly in Lambeth and bespoke training is delivered to whole staff teams in schools and settings beyond Lambeth on request.
7.0 Improving Parental Health & Wellbeing
Having good physical and mental wellbeing is important in enabling parents to provide a positive, healthy and stable home environment for children. Conversely, being in poor health or experiencing mental health issues can be a barrier to positive parenting.6 Direct work with parents and caregivers to improve their health and wellbeing is therefore a focus of LEAP across the following areas:
Supporting women to have a healthier diet and be more active during pregnancy (CAN)
Encouraging families to eat healthily, socialise, and be physically active (HLP)
Helping parents to deal with the stresses of parenting and recognise the importance of their own mental health and wellbeing (PAIRS, Circle of Security Parenting, Baby Steps, Baby and Us and Being a Parent)
Supporting positive family relationships and providing specialist support to those at risk of or experiencing domestic abuse (PAIRS, Circle of Security Parenting, Baby Steps, Baby and Us, Being a Parent and LEAP Enhanced Caseworkers – Gaia)
7.1 Healthy diet and physical activity
During pregnancy, a mother’s diet and physical health is important in providing a good environment for a child to develop. Consumption of harmful substances during pregnancy, for example smoking, alcohol, or illegal drugs, can negatively impact development and cause long-term harm.63 64 65
A higher BMI during pregnancy is associated with high birthweight and increased risk of a child being overweight or obese. The effects can be lifelong, being linked to higher rates of heart disease, asthma, stroke, and type 2 diabetes.66 67 Weight gain during pregnancy is also independently associated with high birthweight and risk of obesity in childhood. 68
In early childhood, a healthy diet and regular physical activity has a positive effect on both adult and child health.69 Children whose parents are more active are more active themselves. Conversely the children of parents who spend more time in sedentary activities, such as watching TV, are less active.70 71 Being in good health helps mothers to positively engage with and care for their children, and is associated with better development outcomes, highlighting the importance of supporting mothers’ physical and mental health.72 Supporting parental health and wellbeing is therefore key in promoting good outcomes for children.
Key findings: Healthy diet and regular physical activity
- CAN is helping pregnant women to be more physically active, by walking more during pregnancy and doing more vigorous activity postnatally. Women from Black, Asian and minority ethnic backgrounds have lower levels of physical activity when entering the service, a difference which is consistent with national surveys.7 This difference remains the same after the programme.
7.2 LEAP’s health and nutrition services
The Community Activity and Nutrition (CAN) programme draws on midwives and health improvement facilitators to support women with a BMI of 25 or higher to adopt healthier diet and activity behaviours during pregnancy and after. The Healthy Living Platform (HLP) also promotes a healthy diet through community pantries and cooking and gardening sessions, but this service has not collected outcomes data to date.
CAN is helping pregnant women to be more physically active, though differences in activity levels by ethnicity remain at the end of the programme.
| Data Type | Timeframe | Sample size(s) |
|---|---|---|
| International Physical Activity Questionnaire (IPAQ) | January 2016 – March 2022 | 485 73 |
The IPAQ asks about time spent in walking, moderate physical activity, and vigorous physical activity over the course of a typical week. Data was cleaned according to the IPAQ scoring protocol74 and time in moderate and vigorous activity was combined into one category, following the approach used by other IPAQ studies.75 Two binary variables, indicating those who spent 150 minutes or more in each activity per week (as recommended by the UK Chief Medical Officers)76 were also generated.
At registration, the average time spent walking per week was 247 minutes, or just over four hours. Just over a third of women spent less than 150 minutes walking per week. The average time spent in moderate or vigorous activity was 44 minutes per week, and almost all women (91%) did this type of activity for less than 150 minutes per week. Over the course of the CAN programme, average time spent walking increased to 347 minutes per week, or over five and a half hours. Average time spent in moderate or vigorous activity did not really change.
At the 6-month follow up, time spent walking had decreased slightly but remained above registration levels at 325 minutes per week, while moderate or vigorous activity had increased to 76 minutes per week. By the 6-month appointment, 14% of women were spending 150 minutes or more in moderate or vigorous activity each week. The proportion spending 150 minutes or more walking per week peaked at three-quarters of women (75%) at the 28-week appointment.
For time spent walking, the change from registration to 28 weeks was significant and equivalent to more than 1.5 hours of additional walking per week (Figure 19).77 This change was sustained at the 6-month follow up at a slightly lower level of an additional hour and 20 minutes each week.78 After CAN, a woman had almost twice the odds of walking for more than 150 minutes per week than before CAN.79
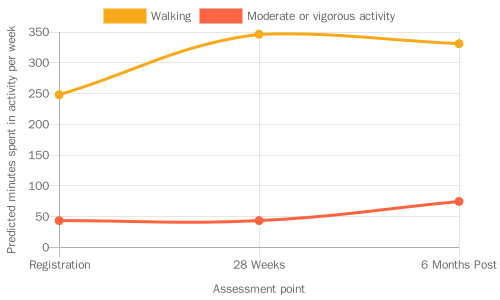
For moderate to vigorous activity, there was no significant change from registration to 28 weeks, but from 28 weeks to 6 months there was a significant increase equivalent to about half an hour per week (Figure 19).80At the 6-month follow-up, women had almost twice the odds of doing more than 150 minutes of moderate or vigorous activity compared to before CAN.81
The increase in walking but not moderate or vigorous activity at 28 weeks may be seen because women are less able to engage in more strenuous activity at 28 weeks pregnant, whereas walking more is more feasible. At the 6-month post-pregnancy follow-up however, women can do more exercise. This may also explain the slight dip in walking time at the follow-up, as women may be exchanging walking for a more strenuous type of activity.
These changes suggest that CAN is beneficial to women in helping them to increase their walking activity during pregnancy. There are also changes post-pregnancy, but these may reflect life with a baby rather than an effect of CAN itself.
Just over half the women with IPAQ scores are Black (54%), around a quarter are White (24%), 12% are of another ethnicity, 6% are Asian and 4% are of mixed ethnicity. Due to the small numbers in these latter categories, these were combined into one ‘other’ category for ease of interpretation. At registration, Black women spent on average 215 minutes per week walking, White women spent on average 315 minutes walking, and women of other ethnicities spent on average 252 minutes walking. At 28 weeks, Black women spent on average 305 minutes walking, White women spent on average 420 minutes walking, and women of other ethnicities spent on average 365 minutes walking.82
For moderate or vigorous activity, at registration Black women spent 34 minutes per week on average, White women spent 67 minutes on average, and women of other ethnicities spent 42 minutes on average. At 28 weeks, Black women spent 29 minutes on average, White women spent 76 minutes on average, and women of other ethnicities spent 49 minutes on average.83
Differences in physical activity levels by ethnicity have also been observed in national surveys.84 85 Reasons for these differences may reflect cultural differences in attitudes to exercise, a lack of time or opportunity for exercise, or discrimination and racism experienced when accessing public spaces to exercise. The CAN team also highlighted the importance of factors such as parity, as women with children already might struggle to find time for exercise. Future reports will investigate these issues in more detail.
7.3 LEAP’s approach to parental mental health and wellbeing
There is growing evidence that poor parental mental health can negatively impact children’s outcomes, and that those from more disadvantaged backgrounds are more likely to experience mental health problems.6
Key findings: Mental health and wellbeing
- On average, mothers participating in Baby Steps have wellbeing levels in line with national averages, but participating mothers living in more deprived areas have lower levels of wellbeing. Future analysis should be able to show how wellbeing changes over the course of the Baby Steps.
7.4 Positive strategies for parents
As well as developing positive parenting behaviours, Baby Steps and EPEC services aim to promote parents’ mental health and wellbeing by discussing strategies for coping with the stresses of family life and encouraging parents to take time for themselves. The PAIRS team and EPEC leads are based within mental health services and so are well-equipped to recognise mental health difficulties and to refer parents for additional support where needed.
Among Baby Steps participants, there were differences in wellbeing by area-level deprivation and ethnicity
Baby Steps uses the Whooley screening tool86 to assess if women might need additional mental health support and refers them on if needed. The service also uses the Short Warwick-Edinburgh Mental Wellbeing Scale (SWEMWBS) to measure mental wellbeing.87
| Data Type | Timeframe | Sample size(s) |
|---|---|---|
| SWEMWBS | December 2021 – March 2022 | 5888 |
SWEMWBS scores for Baby Steps participants ranged from 16.9 to 32.6, with an average of 23.98. This is statistically similar to the population mean for women of 23.59.89 About two-thirds of participants (67%) had average wellbeing, 10% had high mental wellbeing, 19% had possible depression and two participants had probable depression.
Women of White ethnicity had an average SWEMWBS score of 24.7, women of Black ethnicity an average score of 22.4, and women of other ethnicities an average score of 24.6.90 These preliminary findings demonstrate differences in wellbeing among LEAP parents which may be exacerbating or exacerbated by the challenges they are already facing. Moving forwards, it will be important to further investigate these trends as more data becomes available.
7.5 Positive family relationships
The nature and quality of inter-parental relationships can also impact children’s outcomes. Persistent, hostile and unresolved conflict can lead to more negative parenting behaviours and a less stable home environment. This may result in increased distress, behavioural problems, anxiety, and poor physical health for the child.91 Although LEAP’s parenting support interventions (e.g. Baby Steps, EPEC) promote healthy co-parenting relationships, their impact on these relationships is not currently measured.
Domestic abuse is distinct from parental conflict and can include physical or sexual abuse; violent or threatening behaviour; controlling or coercive behaviour; economic abuse; and/or psychological, emotional or other abuse. Experiencing domestic abuse can be very harmful both for adult victims and for children’s physical health, emotional and social development, and behaviour.92 93 LEAP aims for more survivors of domestic abuse to access appropriate specialist support.
7.6 LEAP Enhanced Casework
LEAP runs the Enhanced Casework (Gaia) service in partnership with The Gaia Centre. Enhanced Caseworkers offer holistic support, including emotional support and practical assistance with issues such as housing and legal matters, to LEAP parents who are experiencing domestic abuse during pregnancy or their child’s early years. The service aims to intervene early, before abuse escalates. Support is tailored to the client through a support plan, and sessions happen virtually or face-to-face at safe venues in the community.
Key findings: Positive family relationships
- Clients are very positive about their experiences with the Enhanced Caseworker service. The service helps them to feel safer, more confident, and reduces negative experiences. The service also reduces clients’ level of distress and risk. Many women are still experiencing abuse or controlling behaviours when they exit the service, highlighting the importance of continued support.
The Enhanced Casework (Gaia) service helps clients feel safer and more confident in seeking help.
| Data Type | Timeframe | Sample size(s) |
|---|---|---|
| Gaia exit questionnaire | April 2019 – March 2022 | Variable94 |
At the end of their interaction with the service, clients answer an exit questionnaire on the immediate impact of the service on their experiences of abuse and their feelings of fear and confidence. Clients also rate their satisfaction with the service on a scale of 1 to 10. The average satisfaction score was 9.5, and nearly three-quarters (73%) of clients gave the top score of 10 (N=77). Clients therefore seem to be very satisfied with the support provided by the service.
In terms of the effectiveness of the service, 99% said they had an increased understanding of power control dynamics, 91% reported a decrease in injuries, and 83% reported a decrease in fear.95 All clients said they felt safer after using the service, with 89% saying they felt much safer. Three-quarters said their quality of life had improved a lot and a further 22% said it had improved a little.
All clients said they were confident in accessing help and support, with 86% saying they felt ‘very confident’. However, only about a third (36%) said that they had experienced an end to all types of abuse and controlling behaviours.96 This is not unexpected as abuse frequently continues for years after the end of a relationship, but it does highlight the importance of signposting to continued support97.
Enhanced Casework clients experience reduced levels of distress and risk
| Data Type | Timeframe | Sample size(s) |
|---|---|---|
| Safe Lives Domestic Abuse, Stalking and Honour-based violence check list (DASH)98 | April 2019 – March 2022 | 102 |
| Clinical Outcomes in Routine Evaluation questionnaire (CORE-10)99 | April 2019 – March 2022 | 108 |
Enhanced Casework clients also complete two outcome measures at both their initial session and their final session. The CORE-10 questionnaire measures psychological distress through a set of 10 questions asking how the respondent has been feeling over the past week, with a higher score indicating greater levels of distress. A categorical score was generated according to the established criteria.100
At the first session, the average CORE-10 score was 14.3. Only 13% of clients had ‘healthy’ scores; 69% had some level of distress, ranging from mild (27%) to severe (7%) (Figure 20). At the exit session, the average score had decreased to 3.8. This represents a significant decrease of 10.5 points from intake to exit.101 At exit, no client was in severe or moderately severe distress, and 75% had ‘healthy’ scores (Figure 20).
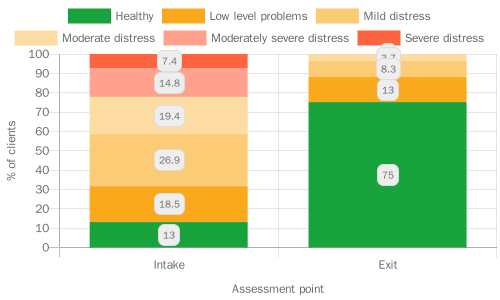
Enhanced Caseworkers also use the Safe Lives Domestic Abuse, Stalking and Honour-based violence (DASH) checklist102 to identify high risk cases and to guide referrals. The checklist is a set of 24 yes/no questions, with the total score equal to the number of ‘yes’ responses. A score of 14 or more is categorised as ‘visible high risk’.
At the first session, the average DASH score was 9.2, and 13% of clients were categorised as ‘visible high risk’. At the exit session, the average score decreased to 4.9 and no clients were categorised as high risk. This represents a significant decrease of 4.3 points over the course of the service.103
Improving parental health and wellbeing: Next steps in learning and evaluation
Future reports will include further data from our Shared Measurement System, including outcomes data on families’ knowledge and confidence from Healthy Living Platform.
Future analyses will hopefully be able to show changes over time in Baby Steps participants’ wellbeing.
Future research will take a more qualitative approach to investigating differences in outcomes between groups, for example Baby Steps wellbeing scores and CAN activity levels.
8.0 Strengthening Families’ Knowledge, Skills & Behaviours
LEAP services aim to equip parents with the knowledge, skills and behaviours they need to provide their children with the best start in life. Services focus on behaviours that have a strong evidence base for their positive impact on children’s long-term outcomes:
Promoting positive, sensitive and responsive parenting (Baby Steps, PAIRS services and Lambeth Parenting groups)
Helping parents to create a more positive home learning environment (Chattertime, Sharing REAL with Parents, and Supporting Babies’ Next Steps)
Supporting mothers practically and emotionally to initiate and continue breastfeeding (Breastfeeding Peer Support)
Improving weaning practices so that more families introduce appropriate food at appropriate times (HENRY Family Nutrition)
8.1 Positive, sensitive, and responsive parenting
When parenting is positive, sensitive, and responsive, parents can recognise their baby’s needs, whether physical or emotional, and respond appropriately. They are curious about how their child might be feeling and viewing the world and can use this to interpret non-verbal cues and other communication.104 Positive, sensitive, and responsive parenting provides the basis for a secure and close bond between a child and their caregiver, known as ‘attachment’.104 Secure attachment to a trusted caregiver is positively associated with language development, social and emotional wellbeing, and academic achievement105, and is a LEAP outcome in its own right (under child-level outcomes). Bonding begins before birth (‘prenatal attachment’) and has a positive impact on the relationship between parent and child after birth.106 107
Key findings: Positive, sensitive, and responsive parenting
- There is a difference between more and less deprived areas in pre-natal attachment scores.
- Parenting services are helping parents to feel more knowledgeable and confident about parenting, and to know where to seek support. Many parents remain anxious and stressed about parenting, highlighting the importance of signposting to further sources of help.
- Baby Steps is helping expectant mothers to feel closer to their unborn child.
- Circle of Security Parenting participants reported fewer feelings of invasion or control and a warmer relationship with their child.
- There is some evidence that PAIRS improves parents’ reflective functioning, but the measurable impact is small.
8.2 LEAP support for parenting and parent-infant relationships
LEAP funds several services to support parents and enhance their relationship with their child, both before birth and in infancy and early childhood:
Lambeth Parenting Programmes:
- Baby Steps: A 9-week group programme for parents with babies between 3 and 8 months old
- Circle of Security Parenting (COSP): An 8-week group programme for parents of children.
PAIRS
- Together Time: A 6-week group programme for parents with babies between 3 and 8 months old.
- One-to-one support: Individual sessions of parent-infant psychotherapy for parents and their infants, in response to an identified need.
What should I consider when looking at parenting outcomes?
LEAP parenting services deal with sensitive issues and aim to build a therapeutic relationship between the practitioner and the parent. It is therefore particularly difficult to measure outcomes for these services. Some parents may not feel comfortable answering sensitive questions, or practitioners may not want to risk damaging trust by introducing long or challenging forms, leading to lower response rates. Even those who complete outcome measures may find the questions too sensitive or abstract, leading to lower-quality data. Outcomes data in this section may therefore not represent outcomes across the whole group of participants.
Part of LEAP’s approach to parenting programmes is to normalise the struggles involved in family life. Practitioners in LEAP parenting services report that over the course of a programme, parents often move from a position of stating that all is well (e.g., in their MORS responses) to acknowledging more ambivalent or mixed feelings. We do not therefore expect to always see improvements in outcomes.
The sample size for several outcomes is relatively small, so most findings in this section are preliminary and will be investigated further as more data becomes available.
LEAP services help parents to feel more knowledgeable and confident about their parenting
| Data Type | Timeframe | Sample size(s) |
|---|---|---|
| Family Questionnaire Data | November 2021 – March 2022 | Baby Steps: 24 COSP: 14 Total: 38 |
At the end of the service, parents attending Baby Steps and COSP answer questions about their attitudes towards and knowledge of parenting, their confidence in parenting, and changes in their knowledge and confidence after taking part in the service.
In general respondents showed positive attitudes towards being a parent, while also acknowledging the challenges of parenting. Almost all COSP parents (93%) said that the service had a positive effect on their enjoyment of parenting, and all agreed that they enjoy being a parent (though only half ‘strongly agreed’). Most Baby Steps parents agreed that they feel prepared and positive about parenthood.108
Nearly a third of parents across the two services felt anxious about being a parent, and more than half of COSP respondents said they find being a parent stressful.109 Experiencing anxiety and stress, to an extent, is a normal part of parenthood and recent years have proved exceptionally challenging for parents of young children, especially in deprived communities. Anxiety and stress reported at the end of the programme may indicate cause for concern for some parents. For others, it may reflect that the parenting programme has succeeded in normalising the struggles involved in family life, enabling parents to feel safe and validated when sharing their experiences.
Almost all respondents reported that attending Baby Steps or COSP had improved their knowledge of parenting (Figure 21). All but one parent said they had high or very high knowledge of positive parenting techniques. Parents also reported improved confidence through attending Baby Steps or COSP (Figure 15). Parents were particularly confident in building a strong bond with their baby / child (66% had very high confidence), and most were confident in responding to their baby’s / child’s needs (58% had very high confidence). Parents were less confident that they could deal with the stresses of being a parent, with only a third (34%) saying they were very confident, and 16% saying they had low or moderate confidence.
Conclusion
In conclusion, LEAP parenting services are helping parents to feel more knowledgeable and confident about parenting, and to better enjoy being a parent. Both services signpost parents to further sources of support should they need them. At the end of the programme, while some parents still felt stressed and anxious about parenting, almost all (95%) felt they had good knowledge of where to find help and advice. In the Baby Steps feedback form, a few parents commented that they would like more time to connect with other parents during the sessions, while in the COSP feedback, one parent asked for a follow up session to catch up with other parents. Further developing opportunities for parents to build a strong support network could help those who remain anxious.
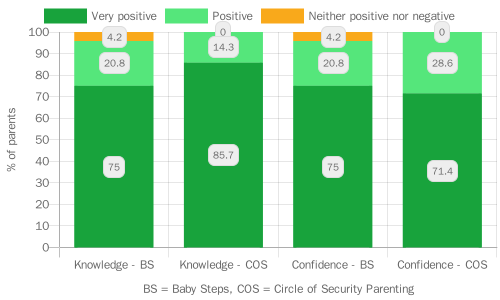
Mothers attending Baby Steps feel closer to their babies by the end of the programme
Baby Steps participants complete the Prenatal Attachment Inventory (PAI) during their first home visit and at their last antenatal session (session 6). The PAI measures a mother’s feelings in relation to their foetus during the previous month.8 A higher score indicates higher levels of attachment.
At the first home visit, the average PAI score was 55.1, while at session 6 the average score was 62, representing an average increase of 6.9 points (95% CI: 5.3 to 8.5).112 Many studies have found that attachment levels tend to increase throughout pregnancy, and so it is difficult to know how much Baby Steps participation contributes to this increase.9
At the first home visit, women in the most deprived neighbourhoods had an average PAI score of 53.1, women in the second most deprived neighbourhoods had an average score of 55.2 and women in less deprived neighbourhoods had an average score of 63. At the final antenatal session, women in the most deprived neighbourhoods had an average PAI score of 58.8, women in the second most deprived neighbourhoods had an average score of 62.5, and women in less deprived neighbourhoods had an average score of 72.113 Facilitators noted that other factors also affect women’s attachment scores, including if they have had a miscarriage or stillbirth in the past or if they are experiencing difficulties during the pregnancy. The Baby Steps team develops a strong relationship with all the women, enabling them to offer additional support and signpost to other services as needed.
COSP participants reported a warmer relationship with their child after the programme
| Tool used | Timeframe | Sample size(s) |
|---|---|---|
| Mothers Object Relations Scale | September 2018 – April 2022 | Baby Steps: 60114 COSP: 79115 |
The Mothers Object Relations Scale (MORS) measures two concepts:
- Warmth, a caregiver’s perception of how warm their infant is towards them, with a higher score indicating more perceived warmth; and
- Invasion, a caregiver’s sense of unwelcome invasion or control by their infant, with a lower score indicating less perceived invasion.
These perceptions are important in determining how a caregiver behaves and interacts with their child.13 Low warmth and high invasion can indicate a situation where the development of the caregiver-infant relationship is at risk, with a potential for rejecting behaviour. Low warmth and low invasion can indicate the potential for neglect.

Table 7: Average MORS warmth and invasion scores for Baby Steps (N=60) and Circle of Security Parenting participants (N=77)
| Warmth Before programme | Warmth After programme | Invasion Before programme | Invasion After programme | |
|---|---|---|---|---|
| Baby Steps | 23.67 | 9.12 | ||
| Circle of Security Parenting | 27.64 | 28.80 | 13.57 | 10.71 |
Table 7 shows the average warmth and invasion scores for parents participating in parenting programmes. According to MORS guidance, average warmth and invasion scores are expected to be around 29 and 10 respectively.116
What should I consider when looking at MORS data?
The MORS assessment is self-completed by parents and so reflects their reported feelings towards their child, rather than representing a practitioner’s assessment of the relationship between parent and child.
The comparison with expected warmth and invasion scores should be made with caution as the expected scores come from studies involving mothers from all White, low-risk community populations, which are less comparable to our diverse sample.117 118
MORS scores for Baby Steps and Circle of Security Parenting participants may also not be directly comparable. Baby Steps participants have new-born infants whereas COSP participants mostly have children aged 1 to 3. COSP parents are likely to have a less ambiguous perception of how their toddler is feeling towards them compared to a Baby Steps parent’s perception of their new-born baby. COSP also has a more exclusive focus on attachment than Baby Steps.
Baby Steps participants had warmth scores around five points lower than the expected score of 29119, and one in four had concerning warmth scores (23% of possible concern and 2% of concern). Invasion scores were closer to the expected average, with 15% of participants having scores of possible concern, and 8% having scores of concern.
For Circle of Security Parenting participants, warmth scores were as expected, with a small increase over the course of the programme. Very few participants had concerning warmth scores, but the proportion with scores of possible concern did decrease, from 9% before to 3% after. COSP participants had higher invasion scores than expected, particularly before the programme, with over half having concerning invasion scores.120 This reduced to 38% after the programme121. While COSP is offered universally, parents may be referred to or access the programme because they are having difficulties in their relationship with their child.
Most parents in the programme also live in more deprived, urban neighbourhoods where overcrowding, financial stress, and lack of outdoor space may exacerbate parents’ feelings of invasion. These conditions would have been made worse by the Covid-19 pandemic. There is no evidence for an association between neighbourhood deprivation and invasion scores, though as there are only a few participants living in less deprived neighbourhoods it may be that there is not enough variation in the sample to detect a difference.
Comparing results before and after the COSP programme, there is a significant increase in warmth scores and a significant decrease in invasion scores.122 The change in concern level is also significant for both warmth and invasion.123 Invasion scores are higher for older children, and there is evidence that the programme leads to a greater reduction for older children compared to younger ones.124 These findings suggest that participation in COSP does improve a parent’s relationship with their child, helping to reduce their reported feelings of invasion and improve their reported feelings of warmth.
PAIRS parents experience small improvements in their ability to think about mental states
| Tool used | Timeframe | Sample size(s) |
|---|---|---|
| Parental Reflective Functioning Questionnaire | February 2018 – January 2022 | PAIRS One-to-One: 21125 PAIRS Together Time: 34 Circle of Security Parenting: 46126 Total: 101 |
Parental reflective functioning refers to a parent’s ability to think about their own and their child’s mental states and how these mental states might influence behaviour. Studies have demonstrated the importance of parental reflective functioning for positive parenting behaviours such as responsiveness, and for the development of secure attachment and emotional regulation in children.14
The PRFQ measures three aspects of parental reflective functioning; ‘pre-mentalising’, ‘certainty’, and ‘interest and curiosity’. ‘Pre-mentalising’ captures negative attributions and an inability to imagine the child’s world (e.g., ‘My child cries around strangers to embarrass me’). Lower pre-mentalising scores therefore indicate greater reflective functioning.
‘Certainty’ captures certainty around understanding a child’s mental states (e.g. ‘I can completely read my child’s mind). Being either very uncertain or very certain indicates lower reflective functioning. Finally, ‘interest and curiosity’ captures interest in a child’s mental states (e.g., ‘I am often curious to find out how my child feels’). Again, both low and high scores may indicate lower reflective functioning, indicating either a lack of interest or an intrusive level of interest.15
Differences between the services are small, the only statistically significant difference was in the interest sub-scale after the programme, with scores for COSP and PAIRS One-to-One participants higher than those for Together Time participants.127 The magnitude of the change also appears to be smaller for Together Time than for COSP and PAIRS One-to-One, though this difference is not statistically significant. This may reflect the shorter length of the Together Time programme and possibly the younger age of children involved.
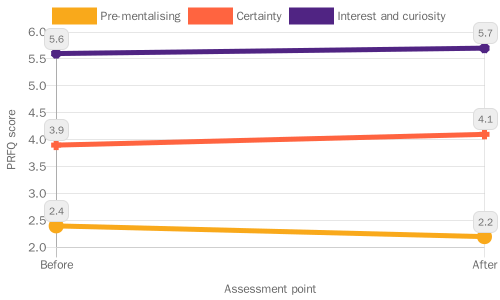
Small differences are seen in scores before and after participation in PAIRS programmes (Figure 22). Scores both before and after the programme are comparable to scores observed in other studies with community samples.128 129 There is a small decrease in pre-mentalising scores and a small increase in interest scores, with no change in certainty scores.130
This indicates that the programmes have an impact on parental reflective functioning. Whether these small improvements result in a meaningful change in parenting behaviour is less clear. A recent meta-analysis of randomised controlled trials of relational early interventions states that “improvements in parental (reflective functioning) that are numerically small may be clinically very important”.14
8.3 Improved home learning environments
Positive home learning environments contribute to children’s social, emotional, and language development, helping to build strong foundations for learning that last throughout a child’s school life.131 132 The effects of the home learning environment on child development are as strong, if not stronger, than the effect of parental income or occupation, emphasising that what parents do is more important than who parents are.133 132
The key elements of a positive home learning environment include parents reading to their child, teaching songs and nursery rhymes, playing with letters and numbers, visiting places outside the home such as the library, painting and drawing, and learning the alphabet.134
Key findings: Improved home learning environments
- LEAP’s communication and language development services are helping parents to feel more knowledgeable and confident in supporting their children with early communication and language.
- Sharing REAL is helping parents to improve their home learning environment within a short time.
- There is some initial evidence that LEAP’s CLD services may be particularly beneficial to parents with English as an additional language.
8.4 LEAP’s Communication and Language Services
Services in LEAP’s Communication and Language Development strand work with parents to support their child’s communication and language development and to provide a positive home learning environment:
- Supporting Babies’ Next Steps: A four-session course for parents of babies aged 0 to 1
- Sharing REAL (Raising Early Achievement in Literacy): A four-session course for parents and carers of children aged 18 months to 3 years
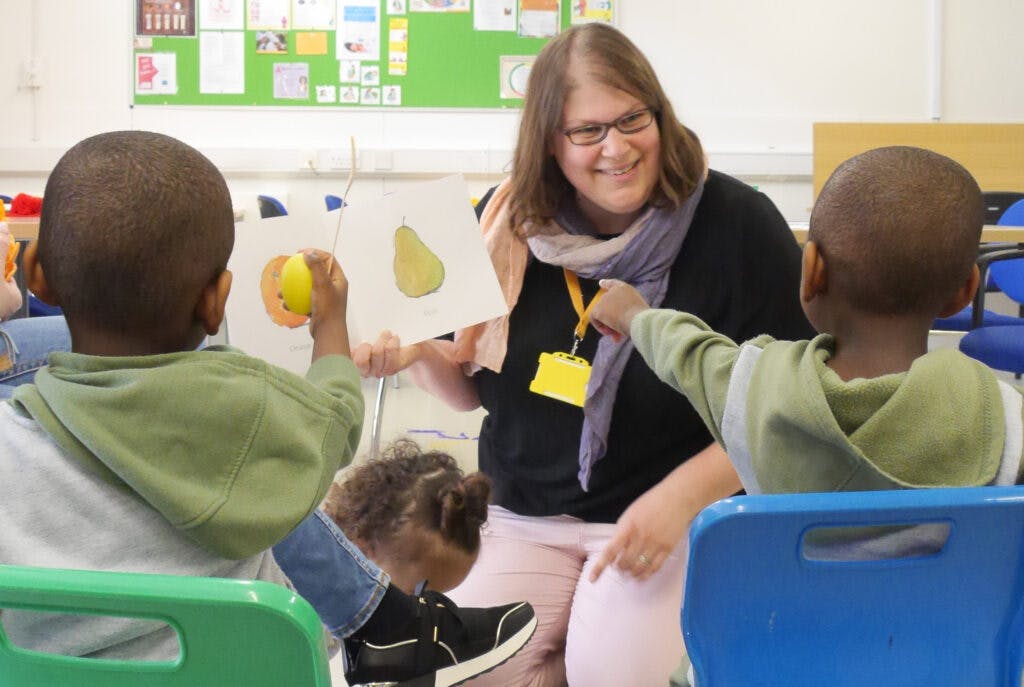
Parents – particularly those whose first language is not English – report a very positive impact of LEAP CLD services
| Tool used | Timeframe | Sample size(s) |
|---|---|---|
| Family Questionnaire | October 2012 – March 2022 | Sharing REAL: 17 Supporting Babies’ next steps: 24 Total: 41135 |
Parents participating in Sharing REAL and/or Supporting Babies’ Next Steps complete a family questionnaire at the final session which collects information on their knowledge about, confidence in, and intention to do activities that support a positive home learning environment. In time this data will also be collected from parents taking part in ‘Chattertime’ sessions. Due to the small sample size these are preliminary findings which will be investigated in further detail once more data is available.
Parents generally felt knowledgeable about promoting communication, language, and literacy at home, with around a quarter rating their knowledge as ‘very high’. Parents’ confidence levels and intention to provide a positive home learning environment were very high, particularly for sharing books and reading, singing, telling stories and saying rhymes, and using daily routines for learning.
Some parents were less confident in more specialised activities such as using the ORIM framework136 (ways in which parents can help their children’s literacy development: Opportunities, Recognition, Interaction and Model), using environmental print, and providing mark making opportunities, and were a little less likely to say they would do these activities following the programme’s end. Emphasising the importance of these aspects of the home learning environment and providing more examples of activities might help parents to feel more confident in implementing them at home.
Overall, parents report a very positive effect of these services on their knowledge and confidence in supporting their child’s early communication, language, and literacy development. It is particularly notable that parents whose primary language is not English report a more positive effect than those whose primary language is English (Figure 23).137 Almost 4 in 10 parents taking part in the programmes speak English as an additional language. Previous studies have shown that children with English as an additional language are 33% less likely to have a ‘good level of development’ at the end of Reception.16] As parents with English as an additional language seem to particularly benefit from LEAP’s CLD programmes, this may be an area in which LEAP is helping to reduce inequalities.
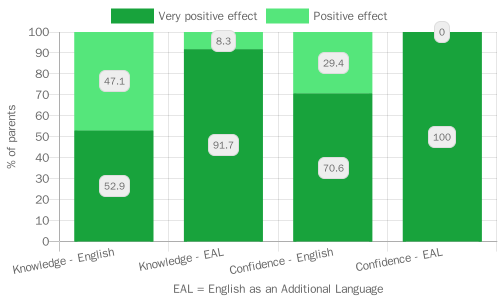
Parents taking part in Sharing REAL improve their home learning environment within a short space of time, though differences remain between parents living in more and less deprived areas
| Tool used | Timeframe | Sample size(s) |
|---|---|---|
| Toddler Home Learning Environment Index | September 2021 – March 2022 | Sharing REAL: 14138 |
Parents and carers attending Sharing REAL complete the Toddler Home Learning Environment (THLE) Index at the first and last session. The THLE measures the frequency with which a parent does various learning activities at home with their child, including reading, messy play, shape sorting, naming everyday objects, and singing songs or saying rhymes.
The THLE consists of eight questions, the first is measured on an eight-point scale and the other seven are measured on a seven-point scale. A respondent’s answers are summed to give a total THLE score, with scores ranging from a minimum of eight to a maximum of 57. The average score for participants at the first session was 38.6 and the average score at the last session was 44.0, representing an increase of 5.4 points (95% C.I.: 2.1 to 8.7 points).139
This indicates that Sharing REAL has a positive impact on families’ home learning environments even within a short space of time. When looking at specific items, significant changes were observed in the frequency of naming things for a child140, naming colours and shapes141, and playing in a messy way.
Before the programme, only one participant said that their child had the chance to play in a messy way with any regularity. Afterwards, most continued to say this was an infrequent activity, but around a third said they did this at least once a week.142
THLE scores were lower for parents living in the most deprived areas both before and after the programme (Figure 24).143 After controlling for time, parents from the second IMD quintile had THLE scores 10.9 points higher than those from the most deprived areas, while those from the third quintile had scores 15.0 points higher.144 There was no indication that the gap between the most and least deprived increased or decreased over the course of the programme.145
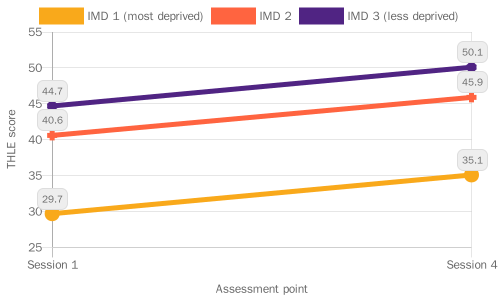
Strengthening families’ knowledge, skills and behaviour: Next steps in learning and evaluation
The Shared Measurement System does not include direct measures of breastfeeding or complimentary feeding outcomes. Instead, future evaluation work will make use of population-level data to examine trends in breastfeeding initiation and continuation. LEAP’s HENRY Family Nutrition service came to an end in 2021 prior to the development of the Shared Measurement System and currently no services are targeting improved complimentary feeding practices. Work is underway to develop new activities around introducing babies to solid food, which will feature in future reporting.
As highlighted above, it is particularly challenging to capture and understand the impact of complex parent-infant relationship services. Qualitative research would enable us to build a more nuanced picture of the impact of these services.
Future reports will include data from the Communication and Language services Chattertime and Making it REAL, which will further build our understanding of how LEAP is impacting parents’ knowledge and confidence in supporting early language and literacy, and adding to our evidence base on the home learning environment.
We have found differences between groups evident in attachment and the home learning environment – future work will aim to understand more about why these differences arise and persist, and anything else LEAP services could do to address them.
8.5 Case Study – PAIRS: Supporting the local workforce to address the infant mental health ‘blind spot’
Infant mental health (IMH) describes social and emotional wellbeing and development in the earliest years of life. It is crucial in laying the foundations for lifelong mental health. Historically there has been a ‘blind spot’ around infant mental health in policy, provision, and workforce development.146 There are only 42 specialist parent-infant teams across the whole of the UK.147 These teams support families directly but also advise on and champion parent-infant relationships across their local systems.148
LEAP’s Parent and Infant Relationship Service (PAIRS) is one of these specialist teams, supporting parents to apply positive, sensitive, and responsive parenting, and promoting secure attachment between infants and their primary caregivers. The PAIRS team offers one-to-one support and group programmes for families.149 These services are receiving positive feedback from families and emergent insights are showing a positive impact on parent-infant outcomes. For more on the PRFQ Outcomes data see Parent Infant Relationships section in this report.
PAIRS works with the Lambeth early years workforce to build the knowledge and skills to respond to infant mental health (IMH) needs and to support parent-infant relationships. This includes workforce training as well as consultations and supervisions to help build the skill and capacity of staff to support infant mental health in their roles.
- This year, feedback on the infant mental health training for the Lambeth Workforce was positive and all practitioners reported they had learnt something new. The recommendation score was slightly lower than for LEAP’s other training offers.150 However practitioners demonstrated an enthusiasm for the training and the offer will be refined based on their feedback.
- Introductory sessions about Together Time offered to Better Start Workers at LEAP children’s centres were rated positively by all practitioners. Practitioners reportedly gained a better understanding of the Together Time sessions and ways to support families’ engagement.
I definitely left the course with a lot more knowledge and would feel very happy and comfortable in recommending the course to a parent.
- Feedback from PAIRS consultations and supervisions are showing that LEAP and Lambeth practitioners alike: rate the sessions positively, are learning more about the parent-infant relationship and that the sessions are supporting them to deliver their services.
The session was very helpful to help process everything that I had heard from the parent and to gain distance. It also helped to reinforce we were on the right path with our plan of action and next steps.
This supervision is essential for helping to clarify cases. I have found this extremely helpful.
Infant Mental Health is an important but overlooked area. LEAP is doing some innovative work to help parents and professionals focus on the parent-infant relationship and promote infant wellbeing across the early years system in Lambeth.
9.0 Practitioner Skills & Early Years Services
9.1 Providing high-quality early years services – key findings
High-quality early years settings and specialist services are vital in supporting families with young children.6 LEAP services aim to provide an inclusive, welcoming, and approachable environment where practitioners listen to families’ concerns and take their needs and experiences seriously.
Key findings: Service provision and quality
- Families rate their experience of LEAP services very highly, finding staff and volunteers to be welcoming, helpful and knowledgeable. Families trust LEAP staff and volunteers and feel that they understand their needs.
- Families are extremely likely to recommend LEAP services to their friends and family, and LEAP’s overall recommendation score is higher than the average among not-for-profits
- LEAP families prefer services to be delivered face-to-face and appreciate opportunities to meet other families.
- Respondents who didn’t give their ethnicity or postcode gave less positive feedback, suggesting that people may be uncomfortable giving more negative feedback. Future qualitative work by our external evaluation partners could look to build a better understanding of more negative experiences.
- When asked what could be improved, LEAP families wanted to see more provision through longer or more frequent sessions.
- Families in more deprived neighbourhoods give less positive feedback than families in less deprived neighbourhoods. LEAP should work to address this to ensure that existing inequalities are not being worsened.
- Asian families were less likely to ‘strongly’ agree that they had a positive experience of a LEAP service, although they still rated LEAP services highly. LEAP should investigate to see if any changes can be made to improve the experiences of Asian families when accessing LEAP services.
9.2 Collecting feedback from LEAP families
As part of the Shared Measurement System, most LEAP services now use a standardised ‘LEAP Family Feedback form’ to understand how families feel about what they provide.151 This section draws on feedback data for 12 different services, submitted by 280 respondents between October 2021 and April 2022. Further detail about feedback data collection and analysis can be found in Appendix 4.
What should I consider when looking at feedback data?
People might not always feel able to be honest about their opinions when giving feedback, especially if their feedback is negative. To help people feel comfortable, we collect feedback anonymously (i.e., people’s answers can’t be linked to them). Some services send people an online survey link. Other services collect paper forms because they get better response rates this way. The practitioner collects the forms in an envelope, and they are processed centrally so that the practitioner does not see individual responses, but people might still feel uncomfortable in giving their honest opinion.
Also, not everyone fills out a feedback form. This means that the responses here are not representative of everyone’s views. This is a problem if only people with good experiences or from certain backgrounds fill out the form. We collect ethnicity and postcode so we can check how representative feedback respondents are of families participating in services. However, there might be other factors, such as language, which also influence people.
Characteristics of family feedback respondents
Questions on ethnicity and postcode in the feedback form are optional. All but 30 people disclosed their ethnicity, with only 4 respondents indicating that they ‘Prefer not to say’ (see Appendix 8). The most common ethnicity among feedback respondents was ‘White’ (39%), followed by ‘Black, African, Caribbean or Black British’ (23%). This is comparable to the ethnicity profile of adults accessing these services within this timeframe, of whom 43% were White and 22% were Black, suggesting in terms of ethnicity, feedback respondents are broadly representative of LEAP service users.152
Only 13 respondents (5%) did not give a postcode, but for a further 10% their postcode was incomplete or invalid (e.g., only the first half was given) and so cannot be used to infer their area deprivation score or whether they live in the LEAP area. Among those with a valid postcode (N=238), 54% are resident in the LEAP area, while a further 42% are resident in other parts of Lambeth. Most respondents (77%) live in more deprived neighbourhoods (Appendix 3)153This appears representative of service participants, among whom 80% lived in more deprived neighbourhoods.154
Respondents who didn’t disclose their ethnicity were also less likely to report a valid postcode (73% of those who did not disclose ethnicity versus 86% of those who did).155 Those who did not disclose their ethnicity or postcode gave less positive feedback than those who did. Figure 25 shows that respondents who did not disclose their ethnicity were consistently less likely to strongly agree with feedback statements compared to respondents who did disclose their ethnicity.
For almost all statements, this difference was statistically significant (p<0.05, indicated on the chart with an asterisk). This may indicate that respondents, particularly those with less positive experiences, were concerned about being identified and therefore reluctant to disclose personal information. Or something else may underlie both a reluctance to disclose ethnicity and a less positive experience of the service, such as a lower level of trust in professionals, or feelings of exclusion.
LEAP services were designed to run face-to-face, but due to Covid-19, several services switched to online delivery. Some continued to run a mix of online and face-to-face sessions during the time period covered here. Out of the 12 services with feedback data, six were face-to-face only156, five services had mixed delivery157, and one service was online only158. The majority of respondents (73%) had attended face-to-face sessions or events; around a fifth (21%) had attended online sessions (Appendix 3).
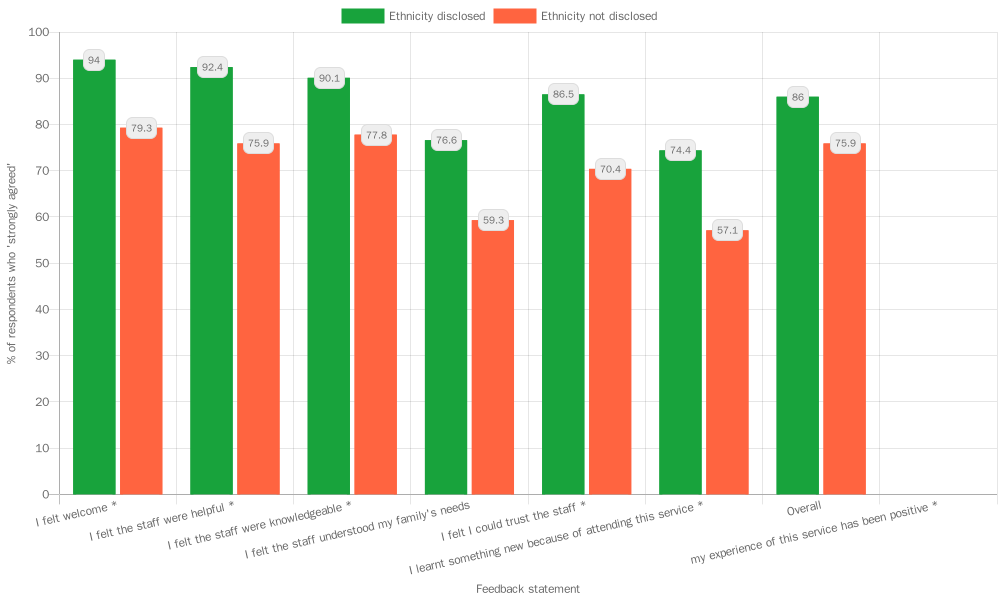
9.3 What do LEAP families think about LEAP services and practitioners?
Feedback on LEAP services is overwhelmingly positive
Most respondents reported positive experiences with the service and its staff or volunteers and were highly likely to recommend the service to friends and family. Overall, almost all respondents agreed that their experiences of LEAP services were positive, with only five respondents (2%) reporting otherwise.
Respondents agreed strongly that LEAP services are welcoming and that LEAP staff are knowledgeable, helpful and trustworthy (Figure 26). Fewer respondents agreed strongly that staff understood their family’s needs or that they learnt something new from the service, but the majority still agreed with these statements.
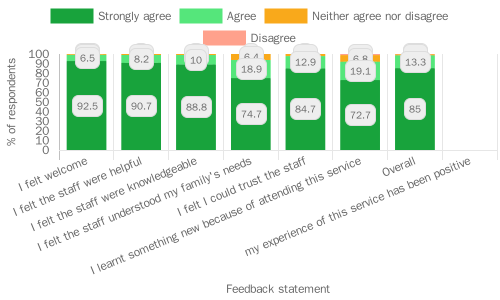
Most respondents would highly recommend LEAP services to family or friends
Respondents are asked how likely they are to recommend the service to family or friends, on a scale from 0 to 10, with 0 being ‘not at all likely’ and 10 being ‘extremely likely’. The recommendation score is used to calculate a ‘net promoter score’, a widely used market research metric. Respondents are classified as ‘detractors’ (score of 0 to 6), ‘passives’ (score of 7 or 8) or ‘promoters’ (score of 9 or 10).
The net promoter score (NPS) is calculated by subtracting the proportion of detractors from the proportion of promoters.159 Overall 89% of respondents were classified as promoters, with 79% giving the top score of 10. Only 3% of respondents were detractors, giving a total NPS for LEAP services of 86.2, considered to be an excellent score.160 LEAP’s score exceeds the average score of 60.9 from a large study of not-for-profit organisations.161
9.4 Do the experiences of under-represented families differ from those of other families?
Given LEAP’s overall aim of reducing inequalities in outcomes, it is important that families from all backgrounds have a positive experience of LEAP services. Here we look at feedback disaggregated by ethnicity, area deprivation, and service access, to investigate any differences in how LEAP services are experienced. These analyses exclude respondents who did not report their ethnicity (N=30) or their postcode (N=42). As these respondents also gave less positive feedback, results should be interpreted with caution as they may underestimate differences by ethnicity or area.
Asian families rated LEAP services less favourably than respondents from other ethnicities
Asian respondents were less likely to ‘strongly agree’ with statements (Figure 27), though these differences were only statistically significant for the question ‘Overall, my experience of this service has been positive’.162 There is some evidence that Asian respondents also gave lower recommendation scores on average (9.2 compared to the overall average of 9.6).163
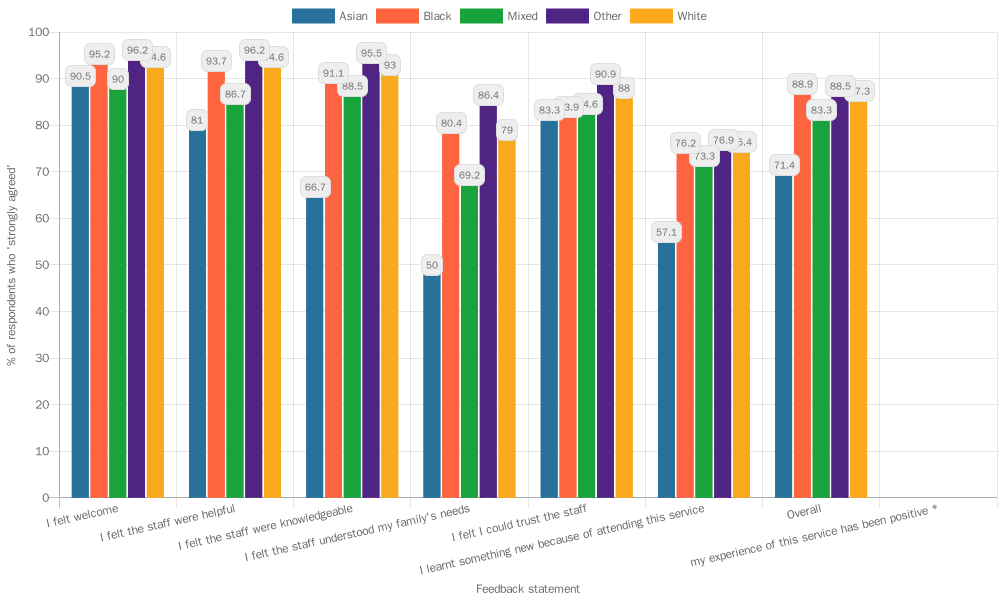

Respondents in more deprived areas gave lower recommendation scores
Respondents in more deprived areas appear to be less likely to trust LEAP staff164 and less likely to have learnt something new from LEAP services165 compared to those in less deprived areas.166 The average recommendation score also decreased with area-level deprivation, with lower scores in more deprived areas although the scores are still considered high (Figure 29).167
It is particularly concerning that those in more deprived areas do not feel they are learning as much from LEAP services, as this may exacerbate existing inequalities. One point to consider could be whether there are communication or language barriers that may be disproportionately affecting those from more deprived areas. The link between deprivation and lower levels of trust has been identified in other studies.17 18
The reasons remain unclear though factors such as marginalisation, negative experiences of public institutions and services, and stress, may play a part. Recent research has established links between early childhood adversity and mistrust in communication from others.168 LEAP may therefore need to do more to gain the trust of those from more deprived areas
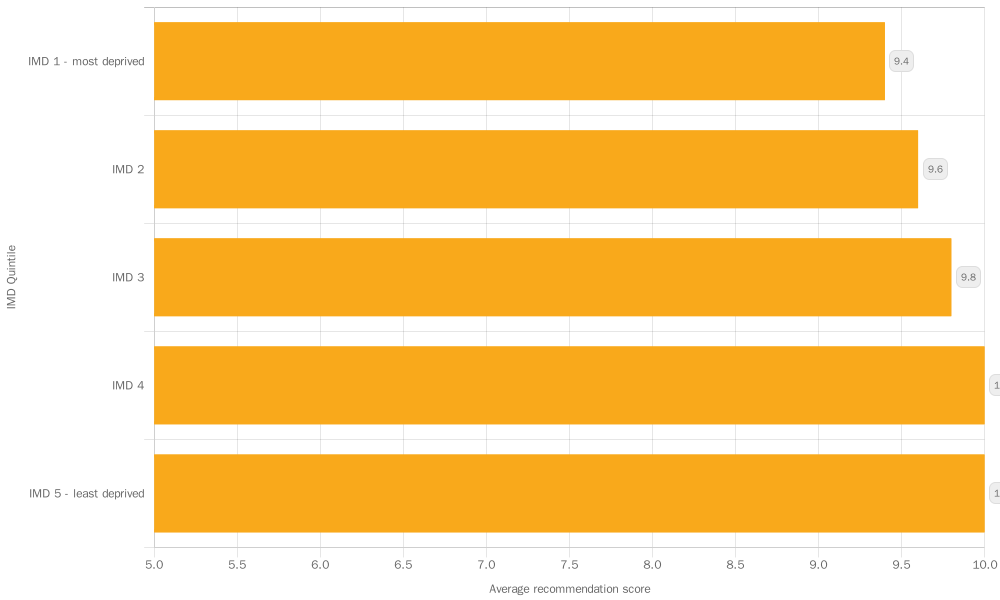
9.5 Does feedback differ according to how the service is delivered?
Respondents prefer face-to-face services over online services
Respondents who attended online services gave recommendation scores on average 0.64 points lower than those who attended face-to-face.169 They were also less likely to agree that staff understood their families’ needs170, and rated their overall experience as less positive.171 As services differ in their delivery mode, it is difficult to untangle the effect of the service from the effect of the delivery mode, but services delivered predominantly online receive lower recommendation scores and less positive feedback overall.172
Several respondents noted that they would have preferred face-to-face sessions, and wanted more interaction within online sessions, particularly to get to know other parents within the group:
Covid permitting, it would be great if some or all of the sessions could be in person in the future so that more connections and interactions with other parents could be made. If not possible perhaps more collaborative tasks and opportunities to talk to and get to know the other parents.
The online format could have been better used and made more inclusive and engaging. For example, we were a small group and it would have been useful to spend time getting to know each other a little so people felt more comfortable sharing experiences and opinions.
Some respondents also highlighted the practical difficulties of online sessions, for example issues with technology and inclusivity of the slides presented, and not allowing enough time for breaks. While online sessions offer flexibility and convenience for some, they do not offer the same opportunities for participants to build relationships with each other and with facilitators and may not be as interactive as face-to-face sessions. Most services have now moved back to face-to-face delivery.
9.6 What do families like or dislike about LEAP services?
LEAP’s Family Feedback questionnaire asks two open ended questions; ‘What did we do well?’ and ‘What could we do better?’. Thematic analysis173 of the responses revealed some recurring themes in families’ experiences of LEAP services, many of which reinforce findings from the analysis above. In terms of what went well, across all of LEAP’s services, families focused their feedback on the quality of staff, in particular the kindness of practitioners. Many respondents remarked on being made to feel welcome, at-ease and free from judgement during their sessions:
Non-judgmental and welcoming provision. Easy to access with the pram. Friendly and supportive team.
Made us both feel very welcome, and it felt like it was safe and okay when things don’t quite go to plan with the recipe! Very helpful and supportive.
Families gained knowledge and felt supported by services
Many respondents reflected on how they had benefited from the service that they attended, describing how they had gained useful information, learning, or received support and advice from attending the sessions:
(the practitioner) was super understanding, I felt listened to, not judged and I felt that the advice I was given was pragmatic (not just “by the book”). I also thought the follow up was stellar: every time I spoke with (the practitioner), she would follow up to see how things were on the next 2-3 day. I got referee to a specialist midwife when the sole support of the group wasn’t sufficient (continuous green poos) Really strong support overall, I can’t imagine how I would have done without it !
The course was very knowledge & insight I learned so much I feel I have the tools to be a great parent.
Families enjoyed well-planned sessions with a variety of topics or activities
Finally, respondents reflected positively on the structure and content of the LEAP services or events they attended. Many remarked on having enjoyed the wide variety of topics and activities on offer and others commended the planning and delivery of the sessions:
The activities/play stations are always v. nicely laid out. I like the mix between activities which are there every week + ‘feature’ activities that change each week. This gives a sense of consistency.
Covered a wide range of topics and encouraged discussion about thoughts and feelings.
Families wanted more frequent or longer sessions
When asked what LEAP could do better, a recurring theme across services was that respondents wanted more, or longer sessions. For those who wanted more sessions, there was a variety of reasons for this including wanting sessions after-hours or on weekends to include working parents and caregivers, more regular sessions in the week to increase availability, and to repeat sessions for when families couldn’t attend:
Be in more places more of the time – more of you please!
More events maybe the same event twice in case you can’t attend.
Families value opportunities to meet and spend time together
Respondents across services requested longer sessions. Additionally, some felt that too much time was spent on course content, and that they would have preferred more time for discussion and opportunities for parents to connect with one another:
More time in breakout sessions, less content delivery. Helps build support network.
Maybe a little more (time) for parents to connect with other parents without stress of looking after active kids.
9.7 Improving the knowledge and skills of early years practitioners
LEAP’s workforce development strategy aims to support and improve the knowledge and skills of the local early years workforce. LEAP also promotes networking and collaborative working between early years professionals. The workforce offer includes training programmes, professional supervision or consultation, workshops, seminars and webinars, events, a quarterly networking meeting (the ‘Provider Forum’), and a fortnightly newsletter (the ‘Provider Update’) sharing news and relevant articles.

Key findings: Workforce skills and expertise
- Practitioners rate LEAP training very highly, feeling that sessions were useful and informative, and that facilitators were friendly and knowledgeable.
- Practitioners suggested that some training sessions could be longer to offer more detail on complex issues such as housing and infant mental health.
9.8 What workforce training has LEAP delivered?
From the start of LEAP to the end of the 2021/22 financial year, LEAP delivered 198 training sessions, seminars, or webinars to 1,681 early years practitioners working in Lambeth or neighbouring boroughs174. Training programmes have aimed to raise awareness and upskill frontline workers such as health visitors, midwives, Children’s Centre staff, family nurses and nursery workers to:
| Number of LEAP practitioners | |
|---|---|
| Identify early speech and language delays, support children’s speech, language, and communication development, and make referrals where appropriate (SaLT Evelina award) | 530 |
| Form trusting relationships and strong partnerships with families accessing Children’s Centres (Family Partnership Model) | 187 |
| Identify, assess and respond to domestic abuse and work effectively with perpetrators of domestic abuse (Domestic Abuse training) | 152 |
| Recognise relationship difficulties and provide appropriate signposting and support (Brief Encounters) | 139 |
| Help parents to support their child’s literacy at home (Making it REAL) | 130 |
| Support families to address sleep issues (Sleep Training) | 118 |
| Provide an effective response to housing and related needs (Housing and Early Years Workforce Training) | 111 |
| Provide high-quality outdoor learning for children (Natural Thinkers) | 110 |
| Incorporate advice on nutrition and physical activity, and raise potential weight issues with families (Addressing Healthy Eating) | 74 |
| Promote key evidence-based messages to improve children’s oral health and implement supervised tooth brushing (Oral Health Service) | 74 |
| Recognise difficulties in the parent-child relationship, respond to infant mental health needs, and improve parent-infant relationships (PAIRS Workforce offer) | 56 |
| Support parents to breastfeed in early years settings (First Milk Matters) | 21 |
In addition, LEAP’s programme of webinars, seminars and study days has provided opportunities for networking and knowledge dissemination to early years practitioners around the country:
| Number of attendees | Number of LEAP attendees | |
|---|---|---|
| Breastfeeding Study Day 2021 | 166 | 42 |
| Breastfeeding Study Day 2022 | 402 | TBC |
| Infant Mental Health Awareness webinar | 164 | 119 |
| Evidence Review presentation | 107 | 42 |
| Natural Thinkers webinar | 91 | 25 |
| Black History Month webinar | 78 | 60 |
| Food and Fuel Poverty webinar | 37 | 36 |
| Covid Research webinar | 21 | 21 |
9.9 What do practitioners think about training provided by LEAP?
Collecting feedback on practitioner training
Services with a training component collect feedback from trainees using a LEAP practitioner feedback form. Some services also collect additional feedback. For example, PAIRS collects data from practitioners they support through supervision or consultation.
Beyond general feedback, only a few services directly collect data about the training’s impact on practitioner’s skills knowledge and confidence, and there is no data for the past year. Practitioner skills are instead evidenced through family feedback on services and through parent and child outcomes.
Further detail about practitioner feedback data collection, its analysis and its limitations can be found in Appendix 4.
Feedback from practitioners on LEAP training was very positive
A total of 88 practitioners gave feedback last year, covering the following trainings:
- Natural Thinkers
- Housing and Early Years Workforce
- Infant Mental Health
- Together Time for Professionals
- Making it REAL
- Oral Health
Feedback on all the trainings was very positive (Figure 30). All participants agreed that information was presented clearly, and 97% agreed that the training met the stated objectives. All but one participant agreed that they had learnt something new from the training and several commented that they had found the training informative and useful.
Feedback on the staff delivering the training was also very positive, with all but one participant feeling that the staff were friendly and 98% feeling that staff were knowledgeable. Overall, 98% agreed that the training experience was positive. For Natural Thinkers and Housing and Early Years Workforce training, comments particularly focused on the facilitators and their passion and knowledge:
Really enjoyed (being) at the sessions and with people who enjoy what they are doing. Very interesting and interactive, making learning fun
(The most useful aspect was) the level of detail in relation to the housing assessment and also the excellent working knowledge of the facilitator. (The facilitator) was very warm, approachable, clear, patient with our questions and very helpful
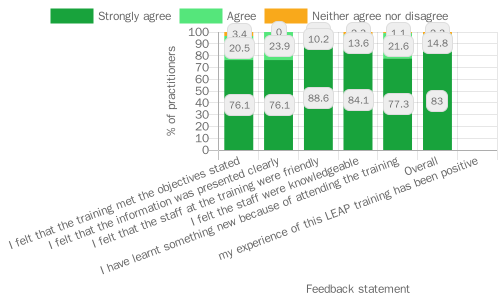
Practitioners were extremely likely to recommend the training to colleagues
The overall net promoter score for LEAP training was 77.3 which is considered to be a good score for training courses.175 Making it REAL and Oral Health training received the top score of 100, while Natural Thinkers and Together Time for Professionals training received scores of 80 or above. The score for Housing and Early Years Workforce training was slightly lower at 73.7, and the Infant Mental Health training received the lowest score at 46.7. For this training, a high proportion of respondents (40%) were ‘passive’, suggesting that it is not perceived negatively per se but that there may be room for improvement to ensure that the training enthuses participants and gives them useful information.
Some practitioners wanted longer, more interactive sessions
Looking at comments left by participants of the Infant Mental Health training, having a longer session could improve the experience to ensure all information can be covered in sufficient detail:
All information was useful, but I wish we had more time
Participants also suggested that having time for group discussions would help to make the training more interactive, and wanted better examples of implementing the training in practice:
I think some of the suggestions for implementation into practice were quite generic… maybe you could do more succinct information sharing, then go into breakout rooms about challenges of implementing in practice and solution focussed
These sessions were ‘bitesize’ pilot sessions but the final training format is intended to be longer (a half-day compared to 90 minutes) which should address some of these suggestions. It should also be noted that infant mental health is a challenging topic and that less positive responses to training are therefore to be expected.
Participants noted similar issues with the length of the Early Years and Housing Workforce training:
I think content will need more time to cover as there is so much to cover
Some practitioners requested extra resources or support
For all trainings, there were areas on which participants requested more information. A few participants wanted additional support alongside the training, for example:
A brief hand-out or fact sheet listing the ideas covered would be very useful as an aide memoir once we have returned to our settings
Would have loved to have received a ready made, editable display following the training!
Once (in) a while, the trainers can arrange a visit to the setting and have some views from the staff and parents
Following up with participants after training with some printable resources or a phone call might therefore help them to put the training into practice.
Practitioner skills and early years services: Next steps in evaluation and learning
Future reports will include new data from practitioners to give better insights into whether training is improving practitioner knowledge, confidence, and skills.
The LEAP team will explore the findings on differences in feedback between groups and consider of whether any of these could be addressed through changes in service delivery as well as identifying any further research that is needed.
Further research might explore qualitative insights on families’ experiences to try to address some of the limitations of feedback forms.
9.10 Case Study: Breastfeeding ‘back to basics’ Lambeth Breastfeeding Network Infant Feeding Study Day 2022
In March 2022, Lambeth’s Breastfeeding Network Peer Support176 team hosted the annual Lambeth Infant Feeding Study Day online. The free, CPD-accredited177, full-day event had a theme of breastfeeding ‘back to basics’. Local, national, and international infant feeding experts178 came together to raise awareness and upskill practitioners working in Lambeth and across the UK on topics including:
- the impact of Covid on infant feeding
- the importance of raising awareness of breast assessment in non-White skin tones
- clarifying the facts around infant milks
- re-establishing back to basics in infant feeding skills
- local mothers also presented on their experiences of breastfeeding children with a cleft lip and palate and children with Down’s Syndrome.
Over 400 practitioners attended on the day including: midwives, health visitors, nurses, maternity support workers, infant feeding coordinators, early years practitioners, lactation consultants, speech and language therapists, Breastfeeding Network peer supporters, volunteers, and doulas.
Feedback from 194 practitioners was very positive179:
- 79% strongly agreed that the study day was relevant to their role
- 74% strongly agreed that there was enough variety of topics covered
- 72% learnt something new because of attending the study day
- 93% gave a recommendation score of 9 or above180
“Having a mixture of parents’ personal experiences, with more academic information gave a variety of styles and helped me maintain attention and focus”
“Study day was so interesting and informative, I’ve definitely learned new things today that will help in my role”
In particular, respondents valued the sessions on the experiences of local mothers and assessment of non-white skin tones, as these were areas in which they had little experience or training:
“The personal experiences were so interesting and informative, I wouldn’t have any experience supporting mothers of babies with clefts or downs syndrome”
“I gained something from all of the speakers but particularly Nekisha as so much of our training contains white skinned images”
Respondents thought the day could be improved by making the sessions more interactive and allowing more time for discussion between attendees and for the speaker Q and A. Some suggested that sessions should be longer, while others wanted the option to register for individual sessions, as they couldn’t attend the whole day. There were many suggestions for future topics, including: tongue tie, nipple infection or thrush, low milk supply, low weight gain, allergies, premature babies, breastfeeding while on medication, and breastfeeding with HIV. These suggestions and ways to improve the running of the webinar will inform the planning for Lambeth’s next infant feeding study day in Spring 2023.
10.0 Conclusion
10.1 Are we having a positive impact on Early Childhood Development outcomes for LEAP children?
Though there are currently significant gaps in the data, particularly around child development outcomes, early evidence suggests that LEAP is achieving some of our intended aims: we are engaging a good range of families, whose demographic characteristics are broadly representative of communities living in the LEAP area. There are, however, some outstanding questions regarding our engagement, particularly in terms of paternal involvement and pathways supporting parents and families to use multiple services.
Feedback from families about the quality of services is consistently very good, as is practitioner feedback about our training and Continuing Professional Development offers. We have found evidence that LEAP parenting services are increasing parents’ knowledge and confidence and that our Community Activity and Nutrition (CAN) service is helping women to increase their physical activity during pregnancy. The Enhanced Casework service has shown a positive impact on clients’ levels of psychological distress and LEAP’s communication and language development services are driving improvements in home learning environments.
10.2 Are we having an impact on inequalities?
Our second overall intended impact is to provide substantive improvement in outcomes to those at greatest risk of poor outcomes, which is our ambition to reduce inequalities in childhood development outcomes within the LEAP area. It is difficult to understand whether we are achieving this aim because assessing the effectiveness of interventions and approaches to reduce inequalities can be complicated and expensive. Here we have presented findings using a before and after comparison within individual services. With this limited approach, there are some positive signs that LEAP’s efforts to address inequalities are working.
LEAP’s services are reaching a broadly representative population and they are consistently improving outcomes for all population groups. Some services may have narrowed inequalities. Parents with English as an additional language, for example, seem to particularly benefit from LEAP’s (Communication and Language Development (CLD) programme. Some differences in health outcomes are seen among different groups of service users which are consistent with findings of national surveys. Better understanding of patterns of inequality in outcomes will be crucial moving forwards.
10.3 What will we do as a result of these findings?
The findings included in this report have prompted potential areas for further research and inquiry. We hope to cover many of these questions in our next piece of Annual Learning Research. We have identified several areas that would benefit from more qualitative insights. There are some findings we would like to explore further internally with our services to drive learning and potential improvement of the LEAP offer. In next year’s report, we will outline how the findings from this research are being used by LEAP for learning and improvement.
10.4 What to expect from next year’s Annual Learning Report?
The 2021 – 22 Annual Learning Report is the first report of its kind. Future reports will build on the learning shared here. At the time of writing, our SMS has been in place/active for 12 months so future Learning Reports will include further evidence of LEAP’s impact as we collect more data. We hope next year to be able to go some way further to assess the question ‘Is LEAP’s Theory of Change working as intended?’, this will be aided by a bigger and more complete data set. By next year, we hope to have linked data from Health Visiting data set and the National Child Measurement Programme data sets, providing additional child development outcomes data. As LEAP’s evaluation work progresses, our Annual Learning Reports will also work to summarise and complement additional outputs from our local and national evaluation.
11.0 Appendices
Appendix 1: LEAP’s Long-Term Outcomes by Domain
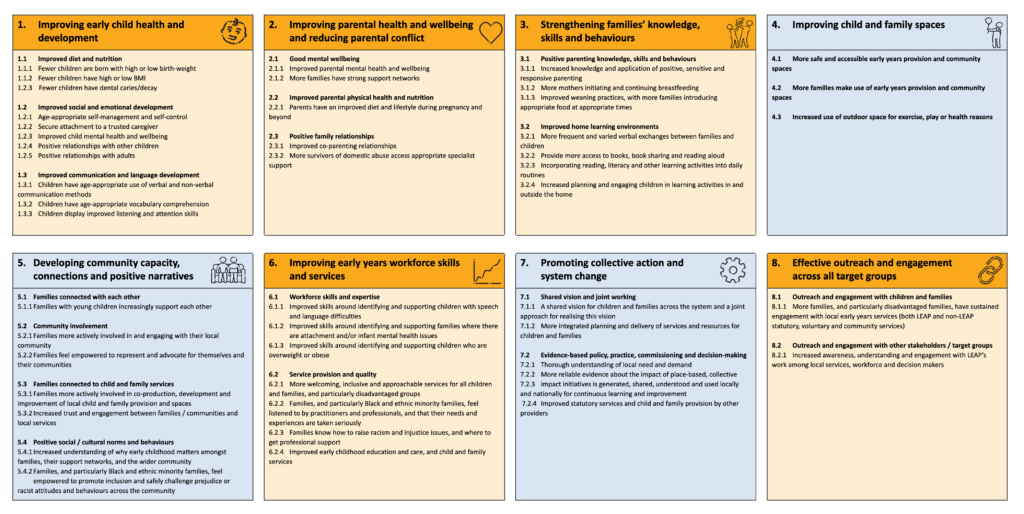
Appendix 2: LEAP’s agreed outcome measures
The agreed outcome measures for Domain 1: Improving early child health and development; Domain 2: Improving parental health and wellbeing; and Domain 3: Strengthening families’ knowledge, skills, and behaviours, are listed below.
Each outcome measure is listed next to the relevant long-term outcome and service(s) that have elected to use each measure. This allows services to see where there are shared measures, and long-term outcomes across LEAP services.
For example, two services (PAIRS One to One and PAIRS Together Time) are aiming to contribute to outcome 1.2.2. Secure attachment to a trusted caregiver and are using three measures to indicate this.
Domain 1: Improving early child health and development
| Long-term outcome | Agreed outcome measure (or data source) | Service(s) using measure |
|---|---|---|
| NEW: Women have improved obstetric outcomes | Badgernet data: mode of birth, preterm and stillbirth | – Caseload Midwifery |
| 1.1.1 Fewer children are born with high or low birth weight | Maternity data: Baby birth weight | – CAN – Caseload Midwifery |
| 1.2.1 Age-appropriate self-management and self-control | Ages and Stages Questionnaire: Social-Emotional (SAQ-SE) | – PAIRS One to One |
| 1.2.2 Secure attachment to a trusted caregiver | Diagnostic Classification of Mental Health and Developmental Disorders of Infancy and Early Childhood (DC: 0-5) pages 134 to 148 | – PAIRS One to One |
| 1.2.3 Improved child mental health and well-being | Leuven Well-Being and Involvement Scales | – Natural Thinkers |
| 1.3 Improved communication and language development | WellComm Toolkit | – Making it REAL – SaLT – Evelina Award |
| 1.3.1 Children have age-appropriate use of verbal and non-verbal communication methods | Ages and Stages Questionnaire (ASQ-3) — Early years foundation stage profile (EYFS) | – SaLT – Evelina Award |
Domain 2: Improving parental health and wellbeing
| Long-term outcome | Agreed outcome measure (or data source) | Service(s) using measure |
|---|---|---|
| 2.1.1 Improved parental mental health and wellbeing | Clinical Outcomes in Routine Evaluation (CORE-10) | – Domestic Abuse – Enhanced Caseworkers (Gaia) |
| Short Warwick Edinburgh Mental Well-being Scale (SWEMWBS) | – Baby Steps – EPEC – Baby and Us – EPEC – Being a Parent | |
| Whooley Questions | – Baby Steps | |
| Parenting Scale | – EPEC – Being a Parent | |
| Common Concerns about my Child (C-CAMC) | – EPEC – Being a Parent | |
| National Institute of Health social support (NIH social support) | – Baby steps – EPEC – Being a Parent | |
| 2.1.2 More families have strong support networks | National Institute of Health social support (NIH social support) | – Baby Steps (TBC) – EPEC – Baby and Us |
| 2.2.1 Parents have an improved diet and physical activity levels during pregnancy and beyond | International Physical Activity Questionnaire (IPAQ) | CAN |
Domain 3: Strengthening families knowledge, skills and behaviours
| Long-term outcome | Agreed outcome measure (or data source) | Service(s) using measure |
|---|---|---|
| 3.1.1 Increased knowledge and application of positive, sensitive and responsive parenting | Prenatal Attachment Inventory (PAI) | Baby Steps |
| Karitane Parenting Confidence Scale | EPEC – Baby and Us | |
| Mothers Object Relations Scale – Short Form (MORS-SF) | Baby Steps, PAIRS – One to One, PAIRS – Together Time, Circle of Security Parenting | |
| Parental Reflective Functioning Questionnaire (PRFQ) | PAIRS – One to one, PAIRS – Together Time, Circle of Security Parenting | |
| 3.1.2 More mothers initiating and continuing breastfeeding | Maternity data: initiation of breastfeeding | Breastfeeding Peer Support, Caseload Midwifery |
| Health visiting data: continuation of breastfeeding at 6-8 weeks | Breastfeeding Peer Support, Caseload Midwifery | |
| 3.2 Improve home learning environments | Early Home Learning Environment Toolkit (EHLEI) | Making it REAL, Sharing REAL with Parents |
Appendix 3: Overview of LEAP Services (accurate for 2021/22)
| Service | Who is the service for? | About the service |
|---|---|---|
| Doorstep Library | Universally offered to Children aged 0-3-years-old living in LEAP areas. Parents or caregivers of children aged 0-3-years-old. Priority given to Families who are struggling to create good home learning environments. Families with children aged 0-3-years-old living on the Loughborough and Tulse Hill Estates. | Doorstep Library volunteers visit families once a week during term time to read and share stories with children and their siblings. Families can take part in a reading session or lend and swap books from the convenience of their home. |
| Making it REAL | Universally offered to Parents or caregivers living in LEAP areas with children aged 0-3-years-old. Early years childcare settings and practitioners. Priority given to Children who would benefit most from the service including those: living in the most deprived neighbourhoods. from a Black/Asian – Black Caribbean, Black African and Black Other background. with English as an additional language. | Making it REAL trains early years practitioners to provide advice and guidance to parents on how to support their child’s literacy at home. This service includes home visiting and working with parents directly. |
| Natural Thinkers | Universally offered to Children aged 0-3-years-old attending an early years setting in a LEAP area early years Childcare settings and practitioners in a LEAP area. Priority given to Children in settings who would benefit most from the service, including: boys. children living in the most deprived neighbourhoods. children from a Black/Asian – Black Caribbean, Black African and Black Other background. | Natural Thinkers offers training to early years practitioners so they can provide high quality outdoor learning for children. The programme focuses on developing children’s wellbeing, involvement, and communication and language development. Through the programme practitioners build their knowledge and understanding to work with parents, demonstrating the importance of connecting children to nature and supporting them with practical ideas to engage their children when they are outdoors. |
| Sharing REAL with Parents | Universally offered to Families with a child aged 18-months to 3-years-old. Priority given to Families of children: – living in the most deprived neighbourhoods. – from a Black/Asian – Black Caribbean, Black African and Black Other background. where there is an existing concern about speech, communication, and language development. | Sharing REAL works with parents to teach them ways of supporting young children’s engagement with books, early writing, songs and rhymes and how to make use of all the print around them in their home, in the street, and in the shops. The training comprises four two-hour sessions. |
| SaLT – Chattertime (Speech and Language Therapy) | Universally offered to Parents or caregivers of children aged 0-3-years-old. Children aged 0-3-years-old living in LEAP areas. | SaLT – Chattertime are group sessions run by a speech and language therapist supported by a setting practitioner who has completed the Evelina Award training for parents. The aim of the sessions is to help parents identify when a SaLT referral is required. A speech and language therapist will offer parents tips on how to support their child’s early speech and language development and offer advice on any concerns. Children are given the opportunity to practice their communication with other children through playing, singing, rhymes and stories. |
| SaLT – Evelina (Speech and Language Therapy) | Universally offered to Early years childcare settings and practitioners in Lambeth. | The SaLT – Evelina Award is a programme of training which aims to enhance early years practitioners’ interactions with children. The training is delivered by speech and language therapists and comprises a baseline audit, training, coaching, and reviews. Through the training practitioners will have improved understanding of speech and language communication (SLC) development, how to support children’s SLC, how to share this knowledge with parents and when/how to make SaLT referrals. Upon successful completion of the training, settings receive the Evelina Communication Friendly Environment Foundation Award. |
| Supporting Babies’ Next Steps | Universally offered to Families with a child aged up to 1-year-old. | Supporting Babies’ Next Steps works with parents to teach them ways of supporting their baby’s communication and language, social, emotional, and physical development. The training comprises four sessions. |
| Community Engagement Team | Universally offered to Families living in a LEAP area with a child aged 0-3-years-old. Priority given to Families of children: – living in the most deprived neighbourhoods, from a Black/Asian – Black Caribbean, Black African and Black Other background. | The Community Engagement team create opportunities for parents to get to know one another and to find out about services; strengthens parent voice and capacity; and equips community organisations with the skills and confidence they need to deliver high-quality early years activities. |
| Breastfeeding Peer Support | Universally offered to Pregnant women living in a LEAP area (antenatal offer). Parents or caregivers living in a LEAP area with a child aged 0-3 years old (postnatal offer). | Breastfeeding Peer Support offers practical, emotional, and informational support about breastfeeding for local parents. The service is led by peer supporters or co-facilitated with health visitors The service works alongside referral-only breastfeeding support groups led by specialist midwives and health visitors. LEAP families are offered an enhanced service of one-to-one contact antenatally and postnatally via phone support and home visits. |
| CAN (Community Activity and Nutrition) | Who is eligible? Pregnant women living in a LEAP area with a BMI above 25. Women from a Black, Asian or Minority Ethnic background. | CAN supports pregnant women to change their behaviour in relation to dietary intake and physical activity. The eight-week service is delivered through three appointments delivered by health trainers and supervised by a midwife. |
| Family Nutrition (Henry) | Who is eligible? Parents with aged 4-6-months-old Families with children who have a high or low BMI | HENRY Family Nutrition providers one-to-one family support which focuses on the individual nutrition and lifestyle needs of each family as well as group-based workshops which cover different diet and nutrition topics that support families to make healthier choices for their daily meals and support a better understanding of the importance of nutrition in early years. |
| HLP (Healthy Living Platform) | Universally offered to Families living in a LEAP area with a child aged 0-3-years-old. Priority given to Families of children who may have additional or greater need and are at risk of poor outcomes. | HLP is a membership-based service for local families. HLP promotes a healthy lifestyle and aims to provide an environment that encourages families to eat healthily, socialise, and be physically active. Community led activities include cook and eat sessions, food growing, and physical activities like Zumba, yoga, and dancing. |
| Oral Health – Supervised Tooth Brushing | Universally offered to Early years childcare settings and practitioners in LEAP areas. | The Oral Health Service promotes good dental practice for early years children. Key oral health messages are promoted through community activities and workshops. Supervised toothbrushing (STB) is supported in private, voluntary, and independent (PVI) childcare settings. The Oral Health Service also works with dentists to support them to be child friendly and to promote early dental attendance and uptake of fluoride varnish. |
| PINE (Pregnancy Information for Nutrition and Exercise) | Who is eligible? Pregnant women living in a LEAP area, between 12 -24 weeks gestation with a BMI between 18.5 and 24.9 (a ‘healthy weight’). | PINE supports women to change their behaviour in relation to dietary intake and physical activity through a one-off workshop. |
| Caseload Midwifery | Universally offered to Pregnant women living in a LEAP area who choose to have their babies at GSTT. Priority given to Pregnant women with additional needs or vulnerabilities including those: who find it difficult to access services (e.g., refugees, asylum seekers, non-native English speakers, sex workers, homeless women, women living in poverty/deprivation, experience of abuse) who need multi-agency services (e.g., women with substance misuse problems, women with physical or learning disabilities, women who were victims of female genital mutilation, women who are subject to safeguarding concerns) | Caseload Midwifery offers continuity of care from a named midwife and team throughout pregnancy, labour, birth, and the postnatal period. Women who meet the established eligibility criteria will be identified, following self or GP referral into GSTT, by midwifery staff using internal procedure. |
| Baby Steps | Universally offered to Pregnant women and their partners living in a LEAP area. Priority given to Families with additional needs or vulnerabilities, including those with mental health problems, who have had some involvement with social care and who delivery staff identify as in need. | Baby Steps is a nine-week perinatal educational service designed to prepare parents-to-be for having a baby, becoming parents, and giving their baby the best possible start. The service includes workshops on how to care for their new baby, reducing the stress that often occurs for parents of a new-born and improving the lives of their babies. |
| Circle of Security Parenting | Who is eligible? Parents or caregivers of children aged between 4-months and 5-years-old. | Circle of Security Parenting is an eight-week group programme that aims to: support parent’s understanding of, and response to, their child’s emotional needs; support parent’s relationship with their child; enhance the development of children’s self-esteem and improve parent’s confidence in their parenting abilities. |
| Enhanced Casework (Gaia) | Who is eligible? Pregnant women, parents or caregivers living in a LEAP area at risk of, or experiencing, domestic abuse. | Enhanced Casework (Gaia) offers support for LEAP parents at risk of, or experiencing, domestic abuse. Caseworkers can work with parents at an earlier stage, more holistically and for longer than traditional domestic abuse services. The service also supports the local workforce to be aware of, and responsive to, domestic abuse. |
| EPEC (Empowering Parents, Empowering Communities) | Who is eligible? Baby and Us: parents or caregivers of babies under 1-year-old. Being a Parent: parents or caregivers of children aged between 2- and 11-years-old. Both courses are offered to families affected by any of the following issues, which indicate increased risk of adverse development outcomes: social exclusion; material deprivation; low income; mental health problems; long standing illness or disability; low educational attainment; recent migrant families; experience of domestic abuse; parents of children with SEN needs; those with protected characteristics (Equality Act 2010). | EPEC offers parenting courses delivered by trained peer facilitators. During the eight-week course participants learn strategies for improving the quality of their interactions with their child; increasing their efficacy and confidence in parenting; and bringing up confident, happy, and co-operative children. |
| Housing and Early Years Workforce Development Coordinator | Who is eligible? Lambeth’s early years workforce, Lambeth’s Housing Needs and Housing Management workforce, Community partners and representatives including LEAP parent volunteers and Early Help teams. | LEAP and Lambeth Council’s Housing Needs division jointly fund a Housing and Workforce Early Years Development Coordinator (WDC) post. The WDC develops and delivers a programme of workforce development to equip Lambeth Early Years Practitioners and Community Partners to be able support families with housing issues. They deliver a parallel programme for Lambeth’s housing workforce so they are well informed about early childhood development and can take this into account when assessing and responding to family needs. |
| PAIRS One-to-One | Who is eligible? Parents or caregivers living in Lambeth, with a child aged 0-3 years old. The essential criterion is the presenting state of the parent-infant relationship, as assessed by the team. The service supports families affected by any of the following issues: – Attachment and bonding difficulties during pregnancy and the early years. – Impact of parental trauma on parenting. – Birth trauma with an impact on the relationship. – Family relationships and difficulties adjusting to parenting. – When parental mental health difficulties impact on the parent-child relationship. – Separation difficulties. – Ongoing issues with feeding and sleep. – Ongoing parental worry about the infant’s health and development. – Ongoing difficulties with developmental tasks e.g., toilet training. – Babies described as difficult to manage or settle. | PAIRS one-to-one service supports parents to enjoy their relationship with their infant. The service provides a non-judgmental, reflective space for parents to observe and think about their babies. PAIRS practitioners provide one-to-one psychotherapeutic support to strengthen the relationship between parents and their infant, support the infant’s development and wellbeing, and supporting parental confidence to manage the stress of being a parent. |
| PAIRS Together Time | Who is eligible? Parents or caregivers living in Lambeth with a child aged 3-8 months old. TBC | PAIRS Together Time is a six-week group programme that aims to enhance parent’s capacity to observe and understand their baby’s cues, mentalize their baby’s experience and reflect on their relationship with their baby Together Time is delivered by trained family professionals using a technique called ‘Watch, Wait and Wonder’ to support parent / infant interaction. |
1 Universal or targeted services– universal services are coloured green in the table. Universal services can be accessed by any family with at least one child aged 0-3-years-old. Note that while these services are open to all families or practitioners caring for children aged 0-3-years-old living in a LEAP area (or Lambeth, where specified). some services seek to prioritise specific groups within this broader demographic. Where this is the case, these groups have been noted in the ‘who is the service for?’ column. Target services are coloured purple in the table. Note that these services have specific eligibility criteria for those attending the service, this is because these services seek to support specific groups within LEAP’s broader eligible group (families of or practitioners for children aged 0-3years-old living in a LEAP area), to offer bespoke support for these groups. Where relevant the target groups and eligibility criteria have been noted in the ‘who is this service for?’ column.
2 Direct beneficiary, also known as target group. This details who the service works directly with. They are not necessarily the same group who the service is trying to ultimately benefit. Where there is more than one direct beneficiary, the primary and secondary groups are identified.
3 Including partners and/or the pregnant woman’s support network.
4 When ‘families’ is used, this refers to a combination of parents or caregivers and their child(ren).
Appendix 4: Report methodology
LEAP’s Data Integration Platform
As a collective impact initiative, it is important that LEAP can link individuals across services. To do this, we needed a unique identifier that would work for all services and that didn’t use personal identifiable information such as name or date of birth. The data platform uses a pseudonymisation approach, which swaps identifiable data for non-identifiable data via an algorithm and creates an ID variable based on a set of common fields. 181The algorithm can be used from different locations to produce the same results.
This means that an individual accessing two different services will generate the same pseudonymised ID for both, enabling their two service records to be linked. NHS services perform their pseudonymisation at source before sending it to the LEAP core team. Other services provide a data extract to the LEAP core team, who then perform pseudonymisation within a restricted environment.
Pseudonymised data extracts are uploaded to the platform on a quarterly basis. At upload, data is checked, cleaned, and matched with existing data. For example, if a new engagement record is matched with an existing LEAP user, their record will be updated with the new activity. Any data quality issues are identified and flagged with the relevant service. An extract from the BadgerNet maternity dataset is also uploaded to the platform, giving access to maternity data for all Lambeth-resident women who book with maternity services at GSTT or KCH. In time, further administrative datasets for Health Visiting and Education will also be added, giving access to outcomes such as child weight and Early Years Foundation Stage (EYFS) assessments.
The platform captures individuals’ journeys through the LEAP system, addressing questions such as the combination and sequencing of services accessed, and the effect on outcomes. There are limitations to the platform data. Only individuals who give consent are uploaded to the platform, so the data is not fully representative of all LEAP service users (though the numbers who do not consent are very low). If the decision to give consent or not is non-random then this will introduce bias into the sample.
Additionally, if someone registers for one service with a different email address or name to the one used to register with another service, they will not be matched by the platform. The platform may therefore underestimate multiple service use. The platform also represents a snapshot of LEAP users and is not able to capture changes in people’s circumstances, for example their movement in and out of the LEAP area, or changes in employment.
Quantitative data overview
This report draws on many different quantitative data sources. Each section indicates the timeframe in which the data was collected and the sample size. Details of statistical analyses and results are given in footnotes where relevant. The threshold used for statistical significance is p<0.05. The following sections give more detail on each type of data used in the report.
Feedback data
Family feedback data collection
Prior to the Shared Measurement System, family feedback data was collected using service-specific forms for CAN, Breastfeeding Peer Support, Baby Steps, and Domestic Abuse – Enhanced Caseworkers. Data was fed back to services through quarterly score cards. As part of the SMS work, a standardised ‘LEAP Family Feedback form’ was developed and is now used by most LEAP services. 182Services now receive a summary of their feedback data through their quarterly service report. The standardised nature of the form means analysis can also be done using data pooled across services, to give an overview of families’ feedback on the quality of LEAP services.
To encourage open and honest responses, the family feedback form is anonymous, but respondents are asked for their home postcode and ethnicity to help with equalities monitoring. Services administer the forms in different ways; some services share a link to an online survey (using SmartSurvey), 183while others ask participants to complete paper forms. Where services use paper forms, these are collected in an envelope and processed centrally so that service providers do not see individual responses.
In the feedback form, respondents are asked a series of Likert-style questions indicating the extent to which they agree or disagree with different statements. The statements vary from service to service, however there are some core questions asked by all or almost all services. 184Respondents are also asked how likely they are to recommend the service to friends or family, on a scale from 0 (not at all likely) to 10 (extremely likely). Finally, there is space for respondents to write comments about what the service did well and what could be improved.
Practitioner feedback data collection
Services with a training component collect feedback from trainees using a LEAP practitioner feedback form. Some services also collect additional feedback using other mechanisms – for example data is collected from practitioners who are supported by PAIRS through supervision or consultation. Baby Steps, PAIRS – Together Time, and Domestic Abuse – Enhanced Caseworkers will also conduct an annual survey of practitioners to collect information on other training and CPD opportunities, though this has not yet been widely implemented.
As with the family feedback data, LEAP practitioner feedback data is either collected via SmartSurvey or via paper forms which are then processed by the LEAP Core team. Like the family feedback form, the practitioner feedback form is anonymous, and respondents are asked for their job role but not their name.
Feedback data limitations
Though services do their best to collect feedback from all respondents, this is not always possible. Response rates also tend to lower for services who have recently rolled out the feedback forms, 185and for those with a more light-touch delivery mode186.
Not all participants complete feedback forms meaning that feedback respondents are not necessarily representative of all service or training participants. Those who respond may be those who are more engaged, those who have more positive experiences, those who feel more confident in completing written forms, or those who are more confident in English, all of which may skew the data. Additionally, respondents may not feel able to be honest or may give the answers they think the service wants (social desirability bias).
It should be noted that this bias may be exacerbated for the practitioner feedback, where training may have been delivered by facilitators who have working relationships with the trainees.
Feedback data analysis
Feedback data was analysed in Stata (version 17) while graphs were produced in Microsoft Excel. Tables of frequencies and means were produced, and preliminary analysis carried out using chi-squared tests, one-way analyses of variance, and t-tests. Linear regression was used to investigate associations between demographic characteristics and feedback scores.
Outcomes data
Outcomes data collection
The Shared Measurement System distinguishes between ‘medium-term outcomes’ and ‘long-term outcomes’. Medium-term outcomes include changes in knowledge, confidence, motivation or behaviour, which are theorised to lead to changes in long-term outcomes. Medium-term outcomes data is collected using ‘family questionnaires’ which were developed with services as part of the Theory of Change and SMS work. Family questionnaires are self-completed by participants either on paper or online. The forms are not anonymous as the service provider matches the form to the individual so that their data can be uploaded to the platform.
Long-term outcomes are collected using validated measures used by other projects or studies. Some are self-completed and some are administered by the service provider.
Outcomes data limitations
LEAP practitioners are skilled at creating trusted relationships with participants or clients, and feedback data demonstrates that participants trust LEAP staff and volunteers. More sensitive measures are all administered by experienced professionals who are able to explain the purpose and reassure respondents. Nonetheless, respondents may report higher levels of knowledge or confidence, or underreport feelings of stress or anxiety, in order to ‘please’ the service provider or conceal perceived ‘negative’ feelings.
Most long-term outcomes are measured before and after the service in order to capture change. Participation in LEAP services is not randomised and no control groups are used, so pre/post analysis is not able to attribute change directly to the service or to comment on what outcomes might have been achieved in the absence of the service. Other explanations for changes in outcomes include access to other forms of support and expected change over time (for example, antenatal attachment is known to increase with gestational age). Both the local and national evaluations will perform more robust analyses to investigate the contribution of LEAP services to long-term outcomes.
As LEAP’s Shared Measurement System has only been in place since October 2021, some outcomes have small sample sizes. Findings should therefore be interpreted with caution and taken as indicative of possible impact. As more data becomes available further analysis will be possible.
Outcomes data analysis
Outcomes data was analysed in Stata. Descriptive analyses were performed to produce frequencies and means. T-tests, chi-squared tests and one-way analyses of variance were used to explore associations between demographic variables (ethnicity, area of residence, neighbourhood deprivation, and home language) and outcomes. For continuous outcomes, a Shapiro-Wilk test was used to assess whether the outcome was normally distributed. Where data was normally distributed, a repeated measures ANOVA was used to assess the difference between pre and post assessments. Where data was not normally distributed, non-parametric methods such as a Wilcoxon signed rank test were used. The effects of demographic variables, and interaction with time, were explored using multi-level mixed-effects linear regression.
Qualitative data
Throughout the report, but particularly within Section 5, quotes from open-text responses are used where possible to illustrate, explain and expand on themes raised by the quantitative analysis. Open text responses from the Family Feedback and Practitioner Feedback were uploaded onto NVivo, coded, then grouped into themes. The quotes included in the report were chosen because they were reflective of the key themes and also represented a range of services and participant experiences. Quotes are given verbatim to preserve the voice of the original respondent.
Helping services learn from the data we collect
A crucial part of LEAP’s Monitoring, Evaluation and Learning work is presenting data back to services. Doing this allows services to answer questions relating to their theories of change, see how their service is performing and make improvements if needed, and better understand who is using their service.
The primary way this happens is through Quarterly Service Reports (QSRs). QSRs are produced in data visualisation software (Power BI187) using data from LEAP’s data platform together with anonymous feedback data from families and practitioners. The reports are published to an online workspace where service providers can access them.
While each report is tailored to the individual service, the reports have features in common. All reports are interactive, meaning service providers can filter them to see specific time periods or areas. Each report provides information on:
- What the service did (number of participants, number of sessions or activities)
- Who the service reached (demographic characteristics)
- How participants engaged (number of sessions attended, proportion completing the programme if relevant)
- What participants thought of the service (feedback data)
- How participants felt as a result of the service (medium-term outcomes such as knowledge and confidence)
- Progress towards long-term outcomes.
Appendix 5: Example Registration Form
LEAP services collect data using a registration form similar to the example. Some services may collect additional fields which are service specific, to better understand considerations for service activities.
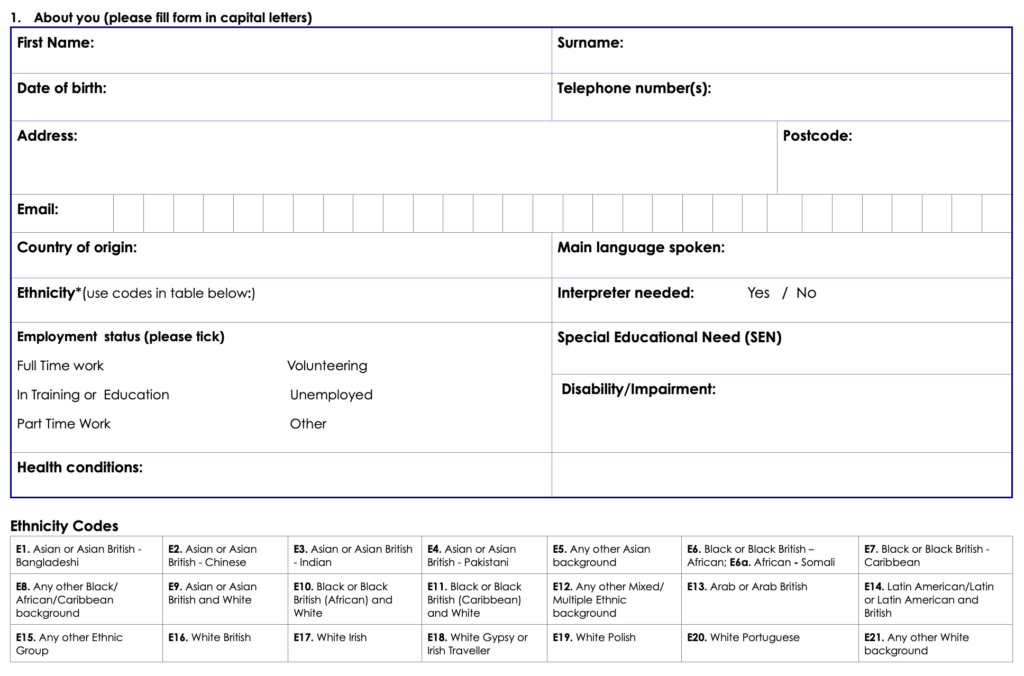
Appendix 6: Full Ethnicity Breakdown of children 0-17
| Ethnicity | Number of Children | % of children |
|---|---|---|
| White British | 1271 | 23% |
| Black or Black British – African | 829 | 15% |
| Any Other White Background | 635 | 12% |
| Black or Black British – Caribbean | 558 | 10% |
| Mixed Any other Mixed Background | 376 | 7% |
| Any other Black Background | 278 | 5% |
| Mixed Black or Black British Caribbean | 248 | 5% |
| Any other background | 213 | 4% |
| Any Other Ethnic Group | 213 | 4% |
| Mixed Black or Black British African | 173 | 3% |
| Mixed Asian or Asian British and White | 156 | 3% |
| White Portuguese | 97 | 2% |
| Other Latin American | 93 | 2% |
| Arab or Arab British | 49 | 1% |
| Asian or Asian British – Indian | 46 | 1% |
| Asian or Asian British – Bangladeshi | 40 | 1% |
| Asian or Asian British – Chinese | 40 | 1% |
| Black or Black British – African Somali | 27 | 0% |
| Asian or Asian British – Pakistani | 27 | 0% |
| White Polish | 21 | 0% |
| White Irish | 21 | 0% |
| White Gypsy or Irish Traveller | 1 | 0% |
Appendix 7: Country of Origin
Table 4 – Country of origin of children accessing the programme
| Country | Number of children | Proportion of children |
|---|---|---|
| United Kingdom | 3423 | 93% |
| Bangladesh | 35 | 1% |
| Any Other Country | 29 | 1% |
| Other African Country | 24 | 1% |
Table 5 – Country of origin of pregnant women accessing the programme
| Country of origin | Number of women | Proportion of women |
|---|---|---|
| United Kingdom | 469 | 41% |
| Turkey | 87 | 8% |
| Any Other Country | 55 | 5% |
| Nigeria | 49 | 4% |
| Portugal | 45 | 4% |
| Jamaica | 40 | 3% |
| Other African Country | 33 | 3% |
| Ghana | 32 | 3% |
Table 6 – Country of origin of parents and caregivers engaging in the programme
| Country of origin | Number of parents and caregivers | Proportion of parents and caregivers |
|---|---|---|
| United Kingdom | 1745 | 51% |
| Any Other Country (unspecificed) | 191 | 6% |
| Nigeria | 120 | 3% |
| Other African Country | 102 | 3% |
| Portugal | 102 | 3% |
| Jamaica | 76 | 2% |
| Other European Country | 70 | 2% |
| Ghana | 64 | 2% |
| Other Asian Country | 63 | 2% |
| Poland | 62 | 2% |
| Somalia | 57 | 2% |
| Eritrea | 56 | 2% |
| Brazil | 54 | 2% |
Appendix 8: Feedback respondent characterists
Table A3 – Characteristics of feedback respondents
| Respondent characteristic | N | % |
|---|---|---|
| Total | 280 | 100 |
| Ethnicity | ||
| Asian or Asian British | 21 | 7.5 |
| Black, African, Caribbean, or Black British | 63 | 22.5 |
| Mixed or multiple ethnic groups | 30 | 10.7 |
| Other ethic groups | 26 | 9.3 |
| White | 110 | 39.3 |
| Prefer not to say | 4 | 1.4 |
| Unknown | 26 | 9.3 |
| Area | ||
| Unknown | 42 | 15.0 |
| LEAP | 129 | 46.1 |
| Non-LEAP Lambeth | 100 | 35.7 |
| Outside Lambeth | 9 | 3.2 |
| IMD quintile | ||
| 1 (most deprived) | 64 | 22.9 |
| 2 | 120 | 42.9 |
| 3 | 47 | 16.8 |
| 4 | 5 | 1.8 |
| 5 (least deprived) | 2 | 0.7 |
| Unknown | 42 | 15.0 |
| How did you access the service? | ||
| Face-to-Face | 204 | 72.9 |
| Online | 60 | 21.4 |
| Both | 11 | 3.9 |
| Other | 4 | 1.4 |
| Unknown | 1 | 0.4 |
12.0 Acronyms
| Abbreviation | Descripton |
|---|---|
| ABS | A Better Start |
| CAN | Community Activity and Nutrition |
| CORE-10 | Clinical Outcomes in Routine Evaluation questionnaire |
| COSP | Circle of Security Parenting |
| CPD | Continuous Professional Development |
| DASH | Safe Lives Domestic Abuse, Stalking and Honour-based violence checklist |
| EPEC | Empowering Parents, Empowering Communities |
| GSTT | Guys and St Thomas’ Hospital |
| IMD | Indices of Multiple Deprivation |
| IPAQ | International Physical Activity Questionnaire |
| KCH | King’s College Hospital |
| LEAP | Lambeth Early Action Partnership |
| MORS-B | Mother Object Relations Scale – My Baby |
| MORS-C | Mother Object Relations Scale – My Child |
| PAI | Pre-natal Attachment Inventory |
| PAIRS | Parent and Infant Relationship Service |
| PINE | Pregnancy Information for Nutrition and Exercise |
| PRFQ | Parental Reflective Functioning Questionnaire |
| QSR | Quarterly Service Report |
| REAL | Raising Early Achievement in Literacy |
| SaLT | Speech and Language Therapy |
| SBNS | Supporting Babies’ Next Steps |
| SMS | Shared Measurement System |
| SRP | Sharing REAL with Parents |
| THLEI | Toddler Home Learning Environment Index |
| ToC | Theory of Change |
13.0 Bilbiography
Books
- Diagnostic Classification of Mental Health and Developmental Disorders of Infancy and Early Childhood: Revised Edition (DC:0-5). Washington, D.C.: Zero to Three, 2016.
- Overton, W.F., Molenaar, P. C. M. & Lerner, R. (eds.). The Handbook of Child Psychology and Developmental Science, 7th Edition. Hoboken, New Jersey: John Wiley & Sons, Inc., 2015.
Reports & Other Documents Published Online
- Asmussen, K. & Brims, L. What works to enhance the effectiveness of the Healthy Child Programme: An evidence update. London: Early Intervention Foundation, 2018. Accessed 10th October, 2022.
https://www.eif.org.uk/report/what-works-to-enhance-the-effectiveness-of-the-healthy-child-programme-an-evidence-update - Burgess, A. & Goldman, R. (2022). Bringing Baby Home: UK fathers in the first year after the birth (full report). Contemporary Fathers in the UK series. London: Fatherhood Institute. http://www.fatherhoodinstitute.org/wp-content/uploads/2022/06/Bringing-Baby-Home-Main-Report.pdf
- CORE System Trust. Clinical Outcomes in Routine Evaluation questionnaire (CORE-10) v1.1. Unknown: CORE System Trust, 2022.
https://www.coresystemtrust.org.uk/wp-content/uploads/2020/07/CORE-10-English.pdf - Curtis, S. et al. Individual and local area factors associated with self-reported wellbeing, perceived social cohesion and sense of attachment to one’s community: analysis of the Understanding Society Survey. London: What Works Wellbeing, 2019. Accessed 5th October, 2022.
https://whatworkswellbeing.org/wp-content/uploads/2020/02/120919-Social-Fragmentation-full-report.pdf - Dartington Service Design Lab et al. Improving the early learning outcomes of children growing up in poverty: A rapid review of the evidence. Buckfast: DSDL, 2018. Accessed 4th October, 2022.
https://static1.squarespace.com/static/5c86931b4d87114c07db1adb/t/5d11f4b220828c00012d82de/1561457851 - Davies, S.C., Atherton, F., McBridge, M., Calderwood, C., et al. UK Chief Medical Officers’ Physical Activity Guidelines. London: Department for Health and Social Care, 2019. Accessed 7th October, 2022.
https://assets.publishing.service.gov.uk/government/uploads/system/uploads/attachment_data/file/832868/uk-chief-medical-officers-physical-activity-guidelines.pdf - Department for Education. Early years foundation stage profile: 2022 handbook. London: Department for Education, 2021. Accessed 10th October, 2022.
https://assets.publishing.service.gov.uk/government/uploads/system/uploads/attachment_data/file/1024319/Early_years_foundation_stage_profile_handbook_2022.pdf - Dyson, A., Kerr, K. and Wellings, C. Developing Children’s Zones for England: What’s the Evidence? London: Save the Children, 2013. Accessed 10th October, 2022.
https://www.savethechildren.org.uk/content/dam/global/reports/advocacy/developing-childrens-zones-summary.pdf - Foster, S. LEAP Maternity Analysis: An exploration of maternity booking data in Lambeth: understanding the demographics and social factors of women booking onto maternity services in Lambeth. Lambeth: LEAP, 2022. Accessed 15th September, 2022.
https://www.leaplambeth.org.uk/files/documents/Exploration%20of%20Maternity%20Booking%20Data%20Final.pdf - Harder+Company Community Research. Feedback from the People Served by Nonprofits and Foundations. Fund for Shared Insight, 2017. Accessed 22nd September, 2022.
https://fundforsharedinsight.org/wp-content/uploads/2018/01/Listen-for-Good-Data-Analysis-Nov-2017.pdf - Harold, G. et al. What works to enhance inter-parental relationships and enhance outcomes for children. London: Early Intervention Foundation, 2016. Accessed 7th October, 2022.
https://www.eif.org.uk/report/what-works-to-enhance-interparental-relationships-and-improve-outcomes-for-children - Higgins, V. & Dale, A. Cathie Marsh Centre for Census and Survey Research Working Paper 2009-05: Ethnic differences in physical activity and obesity. Manchester: Cathie Marsh Institute for Social Research, 2009. Accessed 7th October, 2022. http://hummedia.manchester.ac.uk/institutes/cmist/archive-publications/working-papers/2009/2009-05-ethnic-differences-in-physical-activity-and-obesity.pdf
- Kelly, L., Sharp, N. & Klein, R. Finding the costs of freedom: How women and children rebuild their lives after domestic violence. London: Solace Women’s Aid, 2014. Accessed 7th October, 2022.
https://www.endviolenceagainstwomen.org.uk/wp-content/uploads/Costs_of_Freedom_Report_-_SWA.pdf - LEAP. LEAP’s response to the Covid-19 pandemic. Lambeth: LEAP, 2021. Accessed 15th September 2022.
https://www.leaplambeth.org.uk/files/documents/LEAP-C19-response_Mar20-Jan21.pdf - LEAP. SMS Publication 1: Practitioner Guide to LEAP’s Shared Measurement System. Lambeth: LEAP, 2021. Accessed 23rd September 2022.
https://www.leaplambeth.org.uk/files/documents/Practitioner%20Guide_FINAL%20v8.pdf - LEAP. SMS Publication 4: Collation of LEAP’s Theories of Change (ToC). Lambeth: LEAP, 2021. Accessed 23rd September, 2022.
https://www.leaplambeth.org.uk/files/documents/Service%20level%20ToC.pdf - LEAP Evaluation and Research. LEAP 2019/20 Strategic Priority: LEAP Measures what matters the most: Consideration of pre-ITT consultation responses. Lambeth: LEAP, 2019. Accessed 23rd September, 2022.
https://www.leaplambeth.org.uk/files/documents/LEAP%20measures%20what%20matters%20the%20most%20-%20consideration%20of%20pre-ITT%20consultation%20responses%20-%20summary.pdf - McFarlane, L. and Wellings, C. The Second Half of LEAP. Lambeth: LEAP, 2020. Accessed 22nd September, 2022.
https://www.leaplambeth.org.uk/files/documents/The%20Second%20Half%20of%20LEAP.pdf - Melhuish, E. Impact of the home learning environment on child cognitive development: Secondary analysis of data from ‘Growing Up in Scotland’. Edinburgh: Scottish Government Social Research, 2010. Accessed 5th October, 2022.
https://digital.nls.uk/pubs/scotgov/2010/impactofthehomelearningenvironment.pdf - Melhuish, E. et al. Technical Paper 7 – The Effective Provision of Pre-School Education (EPPE) Project: Social/behavioural and Cognitive Development at 3-4 years in relation to family background. London: Institute of Education University of London, 2001. Accessed 5th October 2022.
https://dera.ioe.ac.uk/18189/10/EPPE_TechnicalPaper_07_2001.pdf - NHS South East London Clinical Commissioning Group. Lambeth DataNet. Lambeth: NHS SE London CCG, 2021. Accessed 15th September, 2022.
https://selondonccg.nhs.uk/wp-content/uploads/2021/04/Lambeth-DataNet.pdf - Parent Infant Foundation. Evidence Brief 3: The benefits of nurturing care: How early interactions influence many aspects of our development. London: Parent Infant Foundation, 2021. Accessed 5th October 2022.
https://parentinfantfoundation.org.uk/wp-content/uploads/2021/06/3.pdf - Parent Infant Foundation. Cardiff Parents Plus: A guide to using and interpreting the MORS-SF. London: Parent Infant Foundation, 2021. Accessed 15th September, 2022.
https://parentinfantfoundation.org.uk/wp-content/uploads/2021/12/MORS-user-info-for-practitioners.pdf - SafeLives. SafeLives Dash risk checklist for the identification of high-risk cases of domestic abuse, stalking and ‘honour’ based violence. Bristol; SafeLives, 2015. Accessed 7th October, 2022.
https://safelives.org.uk/sites/default/files/resources/Dash%20for%20IDVAs%20FINAL_0.pdf - Sheehy-Skeffington, J. & Rea, J. How poverty affects people’s decision-making processes. York: Joseph Rowntree Foundation, 2017. Accessed 5th October, 2022.
https://www.lse.ac.uk/business/consulting/assets/documents/how-poverty-affects-peoples-decision-making-processes.pdf - Stanley, N. and Flood, S. Signposts 7: Children experiencing domestic violence: A research review. Totnes: The Dartington Hall Trust, 2011. Accessed 7th October, 2022.
https://barnsleygovuk-test.azurewebsites.net/media/4345/domesticviolencesignpostsresearchinpractice-july2012.pdf - Strand, S., Malmberg, L. & Hall, J.. English as an Additional Language (EAL) and educational achievement in England: An analysis of the National Pupil Database. Oxford: Department of Education University of Oxford, 2015. Accessed 15th September 2022.
https://www.bell-foundation.org.uk/app/uploads/2017/05/EALachievementStrand-1.pdf - Taggart, B. et al. Effective pre-school, primary and secondary education project (EPPSE 3-16+): How pre-school influences children and young people’s attainment and developmental outcomes over time: Research Brief. London: Department for Education, 2015. Accessed 5th October, 2022.
https://assets.publishing.service.gov.uk/government/uploads/system/uploads/attachment_data/file/455670/RB455_Effective_pre-school_primary_and_secondary_education_project.pdf.pdf - Unknown. Instructions for Scoring the CORE-10. 2015. Accessed 7th October, 2022.
https://sheffield.wp.catalyse.uk.com/wp-content/uploads/sites/2/2014/10/CORE-10-Scoring-instructions.pdf
Journal Articles
- Abbott, G. et al. “Cross-sectional and longitudinal associations between parents’ and preschoolers’ physical activity and television viewing: the HAPPY study.” Journal of Physical Activity & Health 13, no. 3 (March 2016): 269-274. Accessed 7th October 2022.
https://doi.org/10.1123/jpah.2015-0136 - Baran, J. et al. “Relationship between Children’s Birth Weight and Birth Length and a Risk of Overweight and Obesity in 4-15-Year-Old Children.” Medicina 55, no. 8 (August 2019). Accessed 7th October 2022.
https://doi.org/10.3390/medicina55080487 - Barlow, J., Sleed, M. & Midgley, N. “Enhancing parental reflective functioning through early dyadic interventions: A systematic review and meta-analysis.” Infant Mental Health Journal 42, no. 1 (January/February 2021): 21-24. Accessed 5th October, 2022.
https://doi.org/10.1002/imhj.21896 - Benoit, D., Parker, K.C.H.and Zeanah, C.H. 1997. Mothers’ Representations of Their Infants Assessed Prenatally: Stability and Association with Infants’ Attachment Classifications. Journal of Child Psychology and Psychiatry 38(3), pp.307–313. Accessed 5th October. 2022. https://psycnet.apa.org/doi/10.1111/j.1469-7610.1997.tb01515.x
- Campbell, C. et al. “Development and validation of a self-report measure of epistemic trust.” PLoS ONE 16, no. 4 (April 2021). Accessed 5th October 2022.
https://doi.org/10.1371/journal.pone.0250264 - Cataudella, Stefania & Lampis, Jessica & Busonera, Alessandra & L., Marino & Zavattini, Giulio Cesare. (2016). From parental-fetal attachment to a parent-infant relationship: A systematic review about prenatal protective and risk factors. Life Span and Disability. XIX. 185-219. https://www.researchgate.net/publication/311069587_From_parental-fetal_attachment_to_a_parent-infant_relationship_A_systematic_review_about_prenatal_protective_and_risk_factors
- Chiavaroli, V. et al. “The associations between maternal BMI and gestational weight gain and health outcomes in offspring at age 1 and 7 years.” Scientific Reports 11 (October 2021). Accessed 5th October, 2022.
https://doi.org/10.1038/s41598-021-99869-7 - Condon, J. T. & Corkindale, C. “The correlates of antenatal attachment in pregnant women.” British Journal of Medical Psychology 70, no. 4 (December 1997): 359-372. Accessed 10th October 2022.
https://doi.org/10.1111/j.2044-8341.1997.tb01912.x - Cooke, D. et al. “Paternal and maternal reflective functioning in the Western Australian Peel Child Health Study.” Infant Mental Health Journal 38, no. 5 (September/October 2017): 561-574. Accessed 5th October, 2022.
https://doi.org/10.1002/imhj.21664 - Forray, A. “Substance use during pregnancy.” F1000Research 5 (May 2016). Accessed 5th October, 2022.
https://doi.org/10.12688/f1000research.7645.1 - Garriguet, D., Colley, R. & Bushnik, T. “Parent-Child association in physical activity and sedentary behaviour.” Health Reports 28, no. 6 (June 2017): 3-11. Accessed 7th October, 2022.
https://pubmed.ncbi.nlm.nih.gov/28636068/ - Godfrey, K.M. et al. “Influence of maternal obesity on the long-term health of offspring.” The Lancet Diabetes and Endocrinology 5, no. 1 (October 2016): 53-64. Accessed 5th October 2022.
https://doi.org/10.1016%2FS2213-8587(16)30107-3 - Goecke, T.W., Voigt, F., Faschingbauer, F., Spangler, G., Beckmann, M.W. and Beetz, A. 2012. The association of prenatal attachment and perinatal factors with pre- and postpartum depression in firsttime mothers. Archives of Gynecology and Obstetrics, 286(2), pp.309– 316. https://doi.org/10.1007/s00404-012-2286-6
- Koletzko, B. et al. “Nutrition during pregnancy, lactation and early childhood and its implications for maternal and long-term child health: The Early Nutrition Project recommendations.” Annals of Nutrition & Metabolism 74, no. 2 (March 2019): 93-106. Accessed 7th October, 2022.
https://doi.org/10.1159/000496471 - Limb, E. S. et al. “Measuring change in trials of physical activity interventions: a comparison of self-report questionnaire and accelerometery within the PACE-UP trial.” International Journal of Behavioural Nutrition and Physical Activity 16, no. 10 (January 2019). Accessed 7th October, 2022.
https://doi.org/10.1186/s12966-018-0762-5 - Luyten, P. et al. “The parental reflective functioning questionnaire: Development and preliminary validation.” PLoS ONE 12, no. 5 (May 2017). Accessed 5th October, 2022.
https://doi.org/10.1371/journal.pone.0176218 - MacDonell, K.W. “The combined and independent impact of witnessed intimate partner violence and child maltreatment.” Partner Abuse 3, no. 3 (2012). Accessed 7th October 2022.
https://doi.org/10.1891/1946-6560.3.3.358 - Mamluk, L. et al. “Low alcohol consumption and pregnancy and childhood outcomes: time to change guidelines indicating apparently ‘safe’ levels of alcohol during pregnancy? A systematic review and meta-analyses.” BMJ Open 7, no. 7 (August 2017). Accessed 5th October 2022.
http://dx.doi.org/10.1136/bmjopen-2016-015410 - Melhuish, E. C. et al. “Effects of the home learning environment and preschool center experience upon literacy and numeracy development in early primary school.” Journal of Social Issues 64, no. 1 (March 2008): 95-114. Accessed 5th October, 2022.
https://doi.org/10.1111/j.1540-4560.2008.00550.x - Mensah, F. K. & Kiernan, K. E. “Maternal general health and children’s cognitive development and behaviour in the early years: findings from the Millennium Cohort Study.” Child: Care, health and development 37, no. 1 (January 2011): 44-54. Accessed 7th October, 2022.
https://doi.org/10.1111/j.1365-2214.2010.01150.x - Muller, M.E. & Mercer, R.T. “Development of the Prenatal Attachment Inventory.” Western Journal of Nursing Research 15, no. 2 (April 1993): 199-215. Accessed 5th October, 2022.
https://doi.org/10.1177/019394599301500205 - Mund, M. et al. “Smoking and pregnancy – a review on the first major environmental risk factor of the unborn.” International Journal of Environmental Research and Public Health 10, no. 12 (November 2013): 6485-6499. Accessed 5th October 2022.
https://doi.org/10.3390/ijerph10126485 - Ng Fat, L. et al. “Evaluating and establishing national norms for mental wellbeing using the short Warwick–Edinburgh Mental Well-being Scale (SWEMWBS): findings from the Health Survey for England.” Quality of Life Research 26, no. 5 (May 2017): 1129-1144. Accessed 7th October, 2022.
https://doi.org/10.1007/s11136-016-1454-8 - Oates, J. & Gervai, J. “Mothers’ perceptions of their infants.” Journal of Prenatal & Perinatal Psychology & Health 33, no. 4 (2019): 282-300. Accessed 5th October, 2022.
http://oro.open.ac.uk/69171/ - Oates, J. et al. “Validation of the Mothers’ Object Relations Scales Short-form (MORS-SF).” Journal of Prenatal & Perinatal Psychology & Health 33, no. 1 (2018): 38-50. Accessed 5th October 2022.
http://oro.open.ac.uk/56660/ - Pazzagli, C. et al. “The Parental Reflective Functioning Questionnaire in mothers and fathers of school-aged children.” Journal of Child and Family Studies 27, no. 1 (January 2018): 80-90. Accessed 10th October, 2022.
https://doi.org/10.1007/s10826-017-0856-8 - Ross, J.A. “High birthweight and cancer: Evidence and implications.” Cancer Epidemiology Biomarkers & Prevention 15, no. 1 (January 2006): 1-2. Accessed 7th October, 2022.
https://doi.org/10.1158/1055-9965.EPI-05-0923 - Siddiqui, A. & Hägglöf, B. “Does maternal prenatal attachment predict postnatal mother-infant interaction?” Early Human Development 59, no. 1 (July 2000): 13-25. Accessed 5th October, 2022.
https://doi.org/10.1016/S0378-3782(00)00076-1 - Skilton, M.R. et al. “High birth weight is associated with obesity and increased carotid wall thickness in young adults.” Arteriosclerosis, Thrombosis, and Vascular Biology 34, no. 5 (May 2014): 1064-1068. Accessed 7th October 2022.
https://doi.org/10.1161/ATVBAHA.113.302934 - Whooley, M. et al. “Case-finding instruments for depression: Two questions are as good as many.” Journal of General Internal Medicine 12 (July 1997): 439-445. Accessed 7th October, 2022.
https://whooleyquestions.ucsf.edu/sites/g/files/tkssra5196/f/Whooley%20et%20al.JGIM%201997.pdf - Yarcheski, A. et al. “A meta-analytic study of predictors of maternal-fetal attachment.” International Journal of Nursing Studies 46, no. 5 (May 2009): 708-715. Accessed 5th October, 2022.
https://doi.org/10.1016/j.ijnurstu.2008.10.013 - Yu, Z. et al. “Pre-pregnancy Body Mass Index in relation to infant birth weight and offspring overweight/obesity: A systematic review and meta-analysis.” PLoS ONE 8, no. 4 (April 2013). Accessed 5th October 2022.
https://doi.org/10.1371/journal.pone.0061627
Websites & Webpages
- Coursecheck. “What’s a good Net Promoter Score?”. Accessed 5th October, 2022.
https://www.coursecheck.com/training-providers/whats-a-good-net-promoter-score - Early Intervention Foundation. “Why early intervention matters: How do we know it works?”. Accessed 15th September 2022.
https://www.eif.org.uk/why-it-matters/how-do-we-know-it-works/ - Encyclopedia on Early Childhood Development. Accessed 15th September 2022.
http://www.child-encyclopedia.com/ - Fathers Voice Consultation Findings | SSBC (smallstepsbigchanges.org.uk) https://www.smallstepsbigchanges.org.uk/knowledge-hub/learning-hub/fathers-voice-consultation-findings
- GOV.UK. “Physical Activity – GOV.UK Ethnicity Facts and Figures”. Accessed 7th October, 2022.
https://www.ethnicity-facts-figures.service.gov.uk/health/diet-and-exercise/physical-inactivity/latest - GOV.UK. “Research and analysis: Hospital tooth extractions of 0- to 19-year-olds”. Accessed 31st August, 2022.
https://www.gov.uk/government/publications/hospital-tooth-extractions-of-0-to-19-year-olds - Harvard University Center on the Developing Child, accessed 15th September, 2022, https://developingchild.harvard.edu/
- Hogg, S., “Where is the I in CAMHS?”. The Association for Child and Adolescent Mental Health. Accessed 15th September 2022.
https://doi.org/10.13056/acamh.12164 - International Physical Activity Questionnaire. “IPAQ scoring protocol”. Accessed 7th October, 2022.
https://sites.google.com/site/theipaq/scoring-protocol - Krisch, J. A. “The science of Dad and the “Father Effect””. Fatherly. Accessed 15th September 2022.
https://www.fatherly.com/health/science-benefits-of-fatherhood-dads-father-effect - LEAP. “The LEAP Knowledge Base: Stats about LEAP and its services”. Accessed 15th September 2022.
https://www.leaplambeth.org.uk/about-leap/stats - LEAP Theory of Change. “Ensuring a better start in life for every child aged 0-3 in the LEAP area of Lambeth”. Accessed 23rd September 2022.
https://theory-of-change.leaplambeth.org.uk - Learning Journals. “What is the Leuven Scale and How to Use It”. Accessed 7th October, 2022.
https://learningjournals.co.uk/what-is-the-leuven-scale-and-how-to-use-it/ - Microsoft Power BI. “Home”. Accessed 7th October 2022.
https://app.powerbi.com/home - Mothers Object Relations Scales. “Mothers Object Relations Scales: Perinatal mental health screening”. Accessed 15th September 2022.
https://www.morscales.org/ - National Children’s Bureau. “Making it REAL”. Accessed 5th October, 2022.
https://www.ncb.org.uk/what-we-do/practice/focusing-early-years/early-childhood-unit/our-current-projects/making-it-real#:~:text=REAL%20uses%20a%20framework%20called,home%20visits%20and%20literacy%20events - Net Promoter. “What is Net Promoter?”. Accessed 4th October 2022.
https://www.netpromoter.com/know/ - Nuffield Trust. “Low birth weight”. Accessed 7th October, 2022.
https://www.nuffieldtrust.org.uk/resource/low-birth-weight - Office for National Statistics. “What is the difference between sex and gender?”. Accessed 15th September, 2022.
https://www.ons.gov.uk/economy/environmentalaccounts/articles/whatisthedifferencebetweensexandgender/2019-02-21#definitions-and-differences - Office for National Statistics. “One in eight British households has no garden”. Accessed 15th September, 2022.https://www.ons.gov.uk/economy/environmentalaccounts/articles/oneineightbritishhouseholdshasnogarden/2020-05-14
- OHID. “Public health profiles (Children achieving at least expected level of communication and language development)”. Accessed 7th October, 2022.
https://fingertips.phe.org.uk/search/school%20readiness#page/4/gid/1/pat/159/par/K02000001/ati/15/are/E92000001/iid/93494/age/34/sex/4/cat/-1/ctp/-1/yrr/1/cid/4/tbm/1 - OHID. “Public health profiles (Dental Caries)”. Accessed 7th October 2022. https://fingertips.phe.org.uk/search/dental%20caries
- OHID. “Public health profiles (Overweight at age 11)”. Accessed 7th October, 2022.
https://fingertips.phe.org.uk/search/year%206%20overweight#page/4/gid/1/pat/159/par/K02000001/ati/15/are/E92000001/iid/92465/age/201/sex/4/cat/-1/ctp/-1/yrr/1/cid/4/tbm/1 - OHID. “Public health profiles (Overweight at school entry)”. Accessed 7th October, 2022.
https://fingertips.phe.org.uk/search/overweight#page/4/gid/1/pat/159/par/K02000001/ati/15/are/E92000001/iid/92464/age/200/sex/4/cat/-1/ctp/-1/yrr/1/cid/4/tbm/1 - Parent Infant Foundation. “Locations”. Accessed 15th September 2022.
https://parentinfantfoundation.org.uk/network/locations/ - Parent Infant Foundation. “What are specialised parent-infant relationship teams?”. Accessed 15th September, 2022.
https://parentinfantfoundation.org.uk/our-work/what-is-a-parent-infant-team/ - SafeLives. “Resources for identifying the risk victims face”. Accessed 7th October, 2022.
https://safelives.org.uk/practice-support/resources-identifying-risk-victims-face - SmartSurvey. “Survey Software”. Accessed 7th October 2022.
https://www.smartsurvey.co.uk/survey-software - The Breastfeeding Network. “Lambeth”. Accessed 10th October, 2022.
https://www.breastfeedingnetwork.org.uk/lambeth/ - Qualtrics. “What is a good Net Promoter Score?”. Accessed 4th October, 2022.
https://www.qualtrics.com/uk/experience-management/customer/good-net-promoter-score/ - Warwick Medical School. “Collect, score, analyse and interpret WEMWBS”. Accessed 7th October, 2022.
https://warwick.ac.uk/fac/sci/med/research/platform/wemwbs/using/howto/; https://warwick.ac.uk/fac/sci/med/research/platform/wemwbs/using/howto/swemwbs_raw_score_to_metric_score_conversion_table.pdf - World Health Organization. “Obesity and overweight”. Accessed 31st August 2022.
https://www.who.int/news-room/fact-sheets/detail/obesity-and-overweight - Zero to Three. “DC:0-5TM Manual and Training”. Accessed 26th September 2022. https://www.zerotothree.org/our-work/learn-professional-development/dc0-5-manual-and-training/
14.0 Acknowledgements
Authors:
- Rose Davidson
- Rowan Ferguson
- Shaneka Foster
- Sophie Hedges
- Charlotte Wray
With thanks to:
- The LEAP Core Team
- LEAP Service leads
- LEAP families
- Anna Feuchtwang, National Children’s Bureau
- Rachel Scantlebury, Lambeth