Full Report
Annual Learning Report 2022/2023
Full report
Annual Learning Report 2022/2023
1.0 About This Report
This is the second of Lambeth Early Action Partnership’s (LEAP) Annual Learning Reports, which report on LEAP’s progress towards its intended aims. The first Annual Learning Report, published in March 2023 and including data from January 2015-April 2022 summarised evidence of LEAP’s progress towards improving Early Child Development outcomes. This report looks in more detail at LEAP’s approaches to engaging families and our reach within the local community.
The LEAP programme is now in its final year. This report will be complemented by a range of other evaluation outputs over the year including service evaluations and a summative evaluation delivered by an external research partner.
For more information about LEAP or this report, please contact leapadmin@ncb.org.uk.
2.0 Message from Laura McFarlane, Director
I am excited to introduce LEAP’s second Annual Learning report.
One of the conversations I have often had with parents and carers is about the challenges of navigating the early years system. They have told me how difficult it can be to know what is available, when and where – particularly if you are new to an area, are a first-time parent, or you have English as an additional language.
Our second Annual Learning Report provides further understanding of the patterns of reach and engagement between families and LEAP services and builds on the insights in our first Annual learning report.
So, I am particularly proud that over the lifetime of the Programme, LEAP has reached a total of 15,374 families, including 14,028 children and 15,254 adults.
Overall, LEAP has engaged an estimated two thirds of the children under 5-years-old living in the areas of Lambeth where LEAP works.
Thousands of families have participated in the wide range of services and activities we have offered which help improve outcomes for very young children, and which support parents and carers. Of the 1,383 responses to LEAP’s Family Feedback Form, 93% ‘strongly agreed’ that LEAP services are welcoming.
Since 2015 LEAP has funded and supported more than twenty local services to meet the needs of families through pregnancy and the early years of childhood. Our LEAP programme is drawing to a planned close in September 2024. Most of LEAP’s services will continue to be provided by Lambeth Council and other partners, offering continuity for families.
Many people are involved in bringing the insights in this report together. From parents who complete questionnaires and feedback forms, to practitioners who regularly submit data. The LEAP Evaluation and Research Team have skilfully analysed and presented these findings.
I offer my thanks to all involved in this work.
I invite you to read this summary for an overview of the findings and then dive deeper into the full report for detailed analysis and examples.
Laura McFarlane
Director
3.0 Executive Summary

3.1 About LEAP
Lambeth Early Action Partnership (LEAP) is one of five local partnerships which make up A Better Start (ABS), a national ten-year (2015-2025) test and learn programme funded by the National Lottery Community Fund that aims to improve the life chances of babies, very young children, and families. LEAP is supported by the National Children’s Bureau charity (NCB) and works with a wide range of families, practitioners, and organisations across Lambeth.
LEAP’s aim is to:
- Improve early child development outcomes for all children living in the LEAP area
- Reduce local inequalities by supporting those at greater risk of poor outcomes
LEAP operates in a focussed area of Lambeth which was selected based on local need, drawing on a range of local evidence that illustrated greater inequalities for young children in this area compared with the rest of Lambeth.
LEAP has funded and developed more than 20 local services to meet the needs of families through pregnancy and the early years of childhood. LEAP is a ‘collective impact initiative’, which means that all our services and activities link together and work towards shared goals to improve outcomes for very young children.
Definition: Collective impact
LEAP is a collective impact initiative which means that all our services and activities link together and work towards shared goals to improve outcomes for very young children.
3.2 About this research
Recent government research on the uptake of early education and childcare entitlements showed an overall decline in the uptake of free entitlements. In particular, it found that London had the lowest uptake rate of both the 3- and 4-year-old universal entitlement (84% uptake) and the targeted 2-year-old entitlement (61% uptake).1
Participation in early years services is particularly beneficial for children facing disadvantages (for example, children from low-income families, children in care, disabled children and children with special educational needs) but uptake among these families is lower than average.1
If services do not effectively engage with families, there is a risk that the development and educational gap between children from better-off families and their disadvantaged peers may widen.2
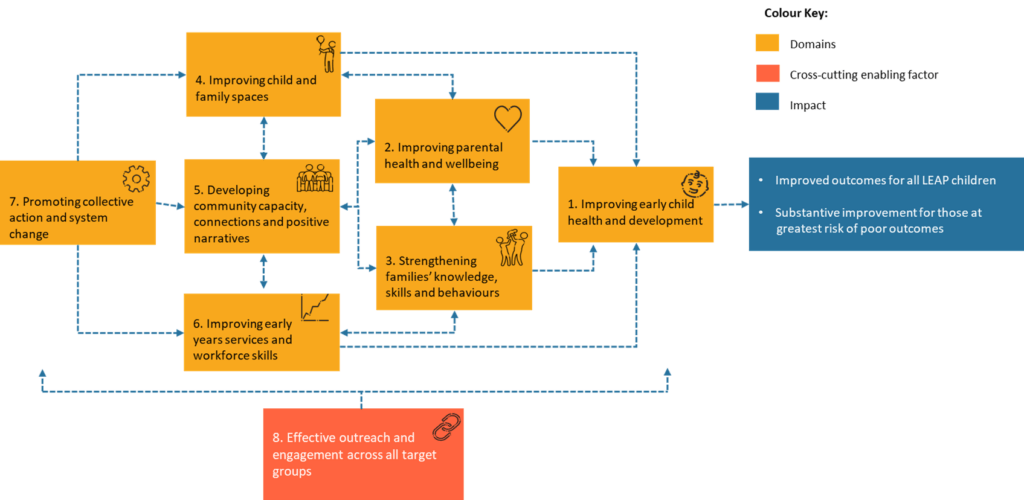
Outreach and engagement with local families is a core aspect of the work of LEAP’s services and is represented in our programme Theory of Change (see Figure A).
We define engagement as families’ interaction with LEAP services or activities.
LEAP’s engagement aims:
- Engage families, with children aged 0-3, and expectant parents, with LEAP activities and services
- Sustain family engagement with LEAP – for continued attendance of a service, and the uptake of multiple services
- Connect families to further provision and support outside of the LEAP offer
This research builds on the insights around LEAP’s engagement presented in the first Annual Learning Report3 which analysed data from January 2015-April 2022. We provide further understanding of the patterns of reach and engagement between families and LEAP services.
This research aims to:
- Document LEAP’s approach to engaging families
- Offer learning around our engagement in terms of who has and hasn’t engaged with LEAP
- Explore the patterns of engagement for different groups of families and services
- Offer some interpretation of patterns of engagement
- Generate questions for future evaluation and research activity
Unless otherwise stated, data included in this report was collected between 23 November 2015 and 31 October 2023.
3.3 Key findings
Over the lifetime of the programme LEAP has reached a total of 15,374 families including:
- 14,028 children
- 15,254 adults
LEAP has engaged an estimated two thirds of children under 5-years-old living in the LEAP area.4
LEAP has delivered 208 training sessions, seminars, or webinars to 1,807 early years practitioners working in Lambeth or neighbouring boroughs.

Read more in Section 6.
3.4 Engaging our priority population
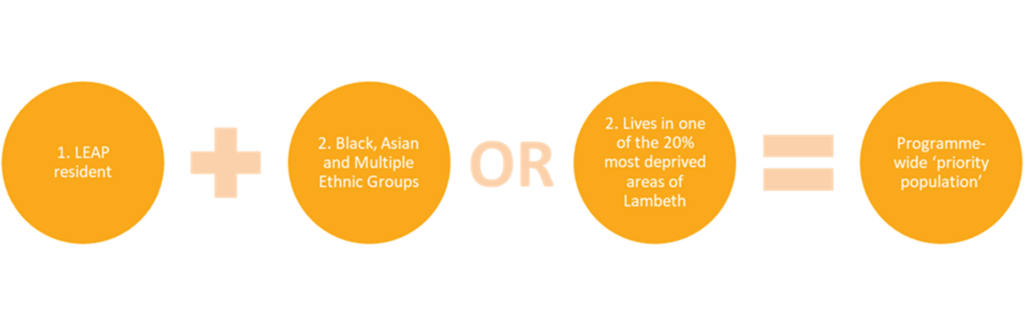
LEAP’s priority population refers to families who live in the LEAP area who are from Black, Asian and Multiple Ethnic Groups and/or live in more deprived areas in Lambeth.
By defining and monitoring our engagement of a priority population across the programme we can assess whether services and activities have been accessible, welcoming, and appropriate for the local community.
Analysis of linked Health Visiting and LEAP engagement records found that 78.9% of children whose family participated in a LEAP service had characteristics consistent with LEAP’s priority population criteria. 77.1% of children whose family had no record of engagement with LEAP services had characteristics consistent with LEAP’s priority population criteria (see Figure C).

Within the context of declining service uptake in Early Childhood Education and Care, LEAP has successfully engaged the local population. Engaged families are representative of our priority population.
Read more in Section 8.
3.5 Families living outside the LEAP area
There has been a high level of service usage by families living outside of the LEAP area (See Figure B).
This might indicate an appetite for similar services more widely, but it also indicative of the nature of delivering a space-bound programme of activities when families’ lives transcend ward boundaries. On average, the families living outside of the LEAP area who are accessing LEAP services have lower levels of neighbourhood deprivation than LEAP area families, this suggests that they may have more resources and are able to travel to access services further from where they live.
However, families from outside the LEAP area generally engaged with fewer services and fewer sessions per service than families from the LEAP area. Families living outside the LEAP area made up 28% of attendances at service sessions, activities, or events, whereas families living inside the LEAP area made up 67% of attendances.
Read more in section 10.
3.6 LEAP’s Community engagement programme
LEAP’s Community Engagement programme has made a positive contribution to families’ engagement with LEAP. Community Engagement events and activities have acted as the front door to LEAP for over 1 in 10 (14.5%) of the families who have engaged with LEAP services.
Of these, 16.4% went on to access LEAP services. Families from LEAP’s priority population were 2.4 times as likely to continue engaging than families not from the priority population.
It is particularly encouraging to see that LEAP’s priority population has been well represented in this pathway, suggesting that Community Engagement events and activities have been appealing and accessible to the families we most wanted to reach.
Our data analysis shows that families who first engaged with a Community Engagement event or activity went on to be more highly-engaged participants in the LEAP programme, accessing a higher number of services as well as attending more sessions per individual service.

Read more in section 12.
3.7 Families rated LEAP services and activities very highly
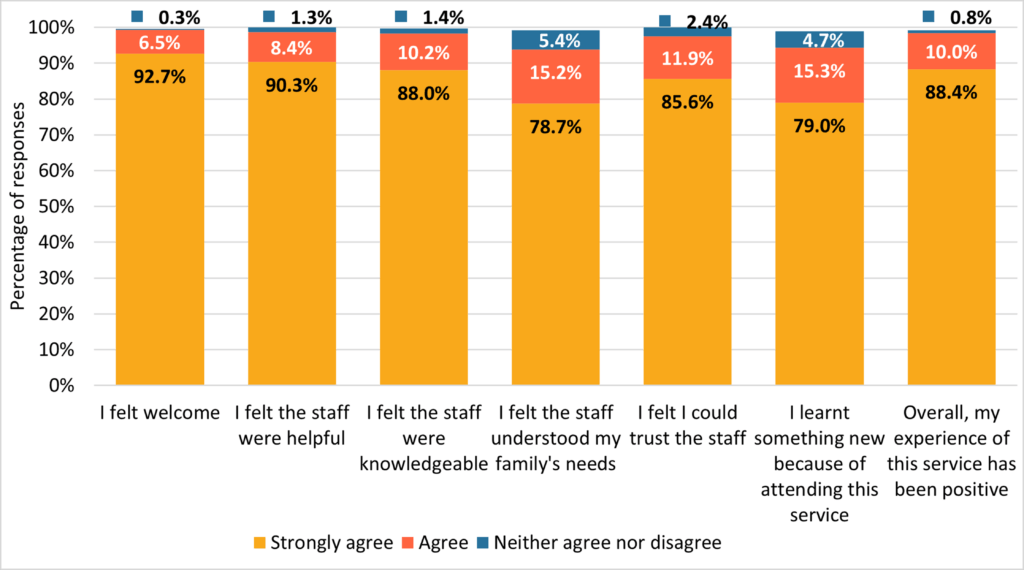
Feedback from families about LEAP services was extremely positive. In the majority of responses, respondents strongly agreed that LEAP services were welcoming (92.7%), and that LEAP staff were knowledgeable (88%), helpful (90.3%) and trustworthy (85.6%) (See Figure E). In most responses, respondents said that they would highly recommend LEAP services and activities to their family or friends.
In qualitative feedback families commended the supportive and safe environment fostered within LEAP services and activities, the high quality of services and facilities and having the opportunity to connect with other families and services.
Read more in section 14.
3.8 Families reported improved knowledge and confidence after attending LEAP services
Improvements in knowledge and confidence are key medium-term outcomes for the LEAP programme and indicate progress towards longer-term childhood development outcomes. They can also provide more insight into families’ experiences of services.
Analysis of medium-term outcome data showed that:
- LEAP’s parenting services helped parents and carers to feel more knowledgeable and confident about their parenting.
- LEAP’s CLD services increased parents’ and carers’ knowledge and confidence around supporting their child’s early communication, language and literacy development. Findings suggests that these services have been particularly beneficial to families with English as an additional language.
- LEAP’s Community Activity and Nutrition service helped parents and carers to feel more knowledgeable and confident about leading a healthy lifestyle.
Read more in section 16.
3.9 Sustained engagement with LEAP services
Once they had engaged with a service or activity, LEAP aimed to sustain families’ engagement in two ways:
- Within a service, families repeatedly attend sessions.
- Within the wider LEAP programme, families go on to access other services.
Analysis of engagement data found that family retention in course-style services was good, with 67.2% of participants reaching a minimum required number of sessions to have benefited from the service and 35.6% completing the course.
22.5% of families access multiple LEAP services.5 This equates to 2,088 families engaging with at least two LEAP services at any point from the beginning of the programme up to October 31st 2023. The majority (77.5%) of families attended only one LEAP service, excluding Community Engagement events or activities. Just over 6% of families (573 families) engage with more than two services.
Families from LEAP’s priority population are more likely to engage with multiple services than families not from our priority population (See Figure F).

When looking at links between services, we can analyse family engagement in terms of which services a family attended and when, or in which order they were accessed. Figure G highlights the most common combinations or pathways of services accessed by families who used two services.
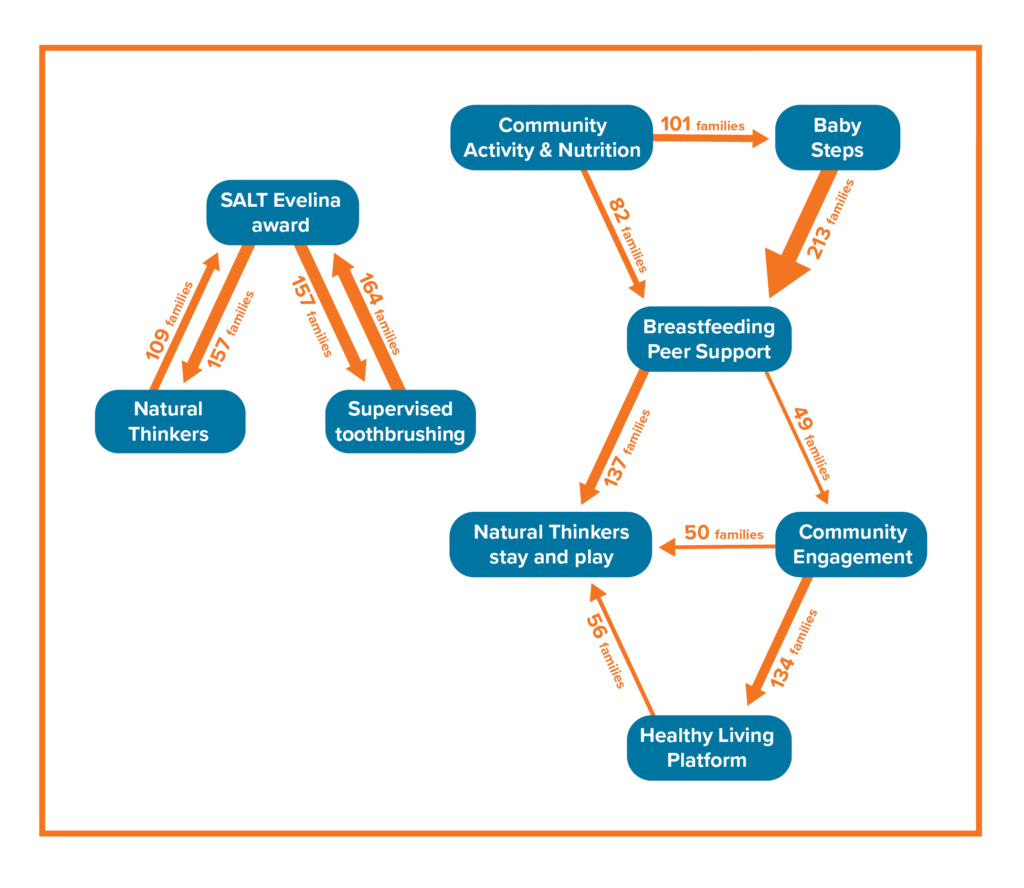
The most common pathways in our network are those between services that are frequently delivered in the same locations.
- In Figure G, the left-hand collection of pathways shows strong links between Natural Thinkers, Speech and Language Evelina Award and Supervised Toothbrushing. These services are all based at and run through local early years settings. Many of these settings have implemented multiple LEAP services at the same time, meaning that children will likely engage with multiple services whilst spending time at the setting they are enrolled at.
Families are likely to benefit from and utilise a network of services that address broadly similar areas of need:
- In Figure G, the right-hand collection of pathways shows strong links between LEAP’s Community Activity and Nutrition (CAN), Baby Steps and Breastfeeding Peer Support. These services are all accessed by families during the perinatal period and work to refer and signpost families between each other as a pregnancy and baby develops.
Families are also more likely to access multiple of the universally available services:
- In Figure G, the right-hand network of pathways shows families frequently attending Community Engagement events or activities as well as the Healthy Living Platform. There is also a strong pathway between these two points and Natural Thinkers stay and play. All three of these services are universally accessible to local families and are more likely to be used by non-LEAP area families compared to LEAP’s targeted or specialist services.
Read more in section 18.
3.10 Enablers and Barriers to family engagement
To build an understanding of some of the drivers of the patterns of family engagement with LEAP, we conducted qualitative interviews with core team members responsible for service management and delivery across the LEAP programme.
Interviews provided insights into:
- perceived factors challenging initial and sustained family engagement with LEAP services and activities; and
- approaches used across the programme to address these barriers and support family engagement
Five key themes were highlighted:
Raising awareness of LEAP: Local families need the right information delivered clearly to understand the services and activities that LEAP offers and how they can be accessed. (See section 9)
Outreach and recruitment capacity: Intentional outreach and person-centred recruitment supports the engagement of families, but service teams need ring-fenced time and capacity to do this. (See section 11)
Responsive and flexible provision: Families are more likely to keep engaging with services that are responsive and flexible to their feedback and needs. (See section 13)
Accessibility of services: services and activities should be delivered in local, accessible spaces to ensure all families can engage. (See section 15)
Trusting Relationships: Families are more likely to engage with services and teams who they feel they can trust to deliver high-quality, and safe provision. (See section 17)
3.11 Conclusions
This report presents in-depth analysis of who has engaged with LEAP services and activities, and how families have engaged. As LEAP enters its final phase, we are pleased to have exceeded our early goal of reaching 10,000 local children.
Against the background of declining uptake of early years offers, the challenges of COVID-19 and the cost-of-living crisis as well as evidence that groups like LEAP’s priority population are least likely to access early years services, the extent of our reach, and the findings that those engaged are representative of our priority population is a significant achievement.
We are also pleased to show the specific contribution of our Community Engagement programme in both the initial and sustained engagement of local families, particularly those from our priority population. This report provides some evidence that working with communities in this way is a valuable and effective approach to supporting the uptake and continued engagement with services.
Families continue to rate LEAP services very highly, with feedback data being consistently positive.
LEAP services are set up to operate primarily within the LEAP area and to be welcoming and accessible to the local community. Feedback data, alongside the findings from engagement data, suggests that this approach has been successful.
Retention of families once engaged with a service was good. Over two thirds of course-style-service participants attend a minimum number of sessions to achieve dosage, where the service is expected to have made some impact, and over one third completed the course and will have been able to benefit fully from the service.
Medium term outcomes data illustrates that most parents felt services were supporting improvements in their knowledge and confidence around supporting their child’s early development.
As a collective impact initiative, it is encouraging to see that 1 in 4 families attended multiple LEAP services over the course of the programme. Analysis of multiple service use data revealed some strong links between particular groups of services.
The most common pathways suggest that families will be more likely to attend several services if they are delivered from the same setting, if they are universally accessible and if they cluster around a particular need with particularly strong pathways in perinatal services that offer support from pregnancy to the post-natal period.
More research could be done into the patterns of multiple service use, LEAP is unable to directly monitor referrals or signposting which could provide a much deeper understanding. However, these findings provide initial patterns of interest to anyone working in a collective impact, or place-based programme.
The themes highlighted throughout the report about the barriers and enablers to family engagement provide insight into the day-to-day approaches being used by LEAP to address these barriers, engage and keep families engaged with services.
Based on the other evidence presented here, we feel confident that these approaches have been working to support engagement with families and will provide valuable insight for programmes and service providers in other areas and contexts.
4.0 Introduction
This is the second of Lambeth Early Action Partnership’s (LEAP) Annual Learning Reports, which report on LEAP’s progress towards its intended aims. The first Annual Learning Report, published in March 2023 and including data from January 2015-April 2022 summarised evidence of LEAP’s progress towards improving Early Child Development outcomes. This report looks in more detail at LEAP’s approaches to engaging families and our reach within the local community.
We provide further understanding of the patterns of reach and engagement between families and LEAP services. This research aims to:
- Document LEAP’s approach to engaging families
- Offer learning around our engagement in terms of who has and hasn’t engaged with LEAP
- Explore the patterns of engagement for different groups of families and services
- Offer some interpretation of patterns of engagement
- Generate questions for future evaluation and research activity
The LEAP programme is now in its final year. This report will be complemented by a range of other evaluation outputs over the year including service evaluations and a summative evaluation delivered by an external research partner.
4.1 What’s in this report
Section 5 of this report outlines LEAPs engagement aims. Section 6 presents data around LEAP’s reach over the lifetime of the programme. Section 7 introduces the qualitative research component which explored the barriers and enablers to family engagement with LEAP services (Sections 9, 11, 13, 15 and 17 provide a closer look at each of the highlighted themes).
Section 8 presents analysis of how well LEAP has engaged with our priority population. Section 10 looks at engagement from families who live outside of the LEAP area. Section 12 looks at data related to the impact of LEAP’s Community Engagement programme in supporting engagement with LEAP services.
Section 14 presents an updated analysis of feedback from families on LEAP services. Section 16 explores the impact of some of LEAP services on parents’ knowledge and confidence. Section 18 looks at sustained engagement with LEAP, both in terms of retention within services and multiple service use.
4.2 About LEAP
Lambeth Early Action Partnership (LEAP) is one of five local partnerships which make up A Better Start (ABS), a national ten-year (2015-2025) test and learn programme funded by the National Lottery Community Fund that aims to improve the life chances of babies, very young children, and families.
LEAP is supported by the National Children’s Bureau charity (NCB) and works with a wide range of children, families, practitioners, and organisations across Lambeth.
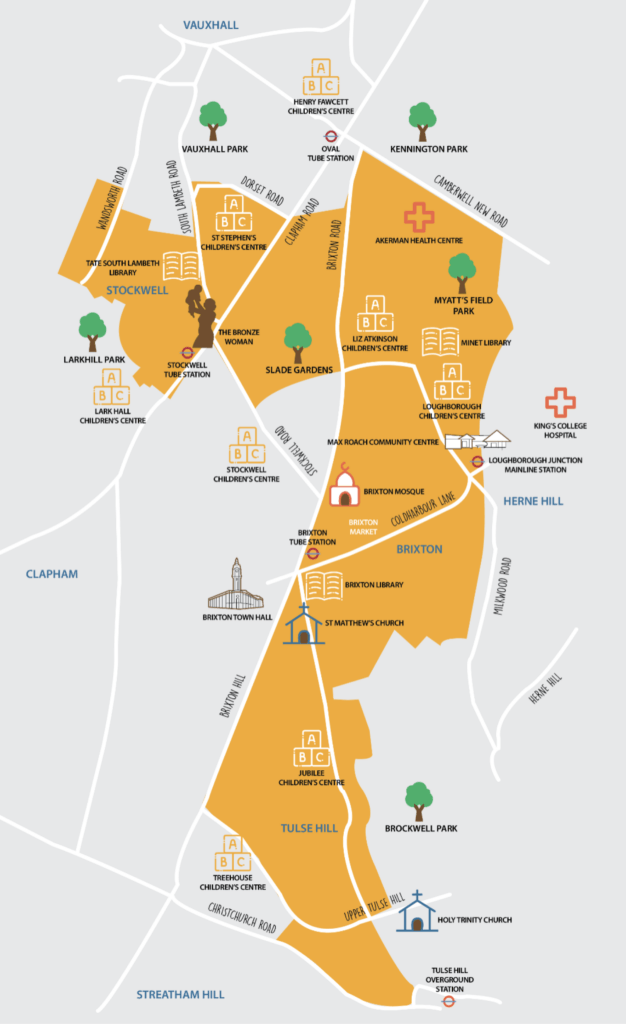
LEAP operates in a focused area of Lambeth (see Figure 1). This area was selected based on local need, drawing on a range of local evidence that illustrated greater inequalities for young children in these areas compared with the rest of Lambeth. Broadly, our target area stretches from Stockwell to Myatt’s Field, down through North Brixton to the top of Tulse Hill, covering about 20% of the borough.
LEAP has funded and developed more than 20 local services to meet the needs of families through pregnancy and the early years of childhood. LEAP is a ‘collective impact initiative’, which means that all our services and activities link together and work towards shared goals to improve outcomes for very young children.
LEAP’s aim is to:
- Improve early child development outcomes for all children living in the LEAP area.
- Reduce local inequalities by supporting those at greater risk of poor outcomes.
While LEAP has some services that are only available to families living in the LEAP area, other services are available to all families living in Lambeth. Services fall into two groups:
- Services that work directly with children to help them reach their developmental milestones.
- Services that support children indirectly, by working with parents and carers, early years practitioners and the wider community, so they are better equipped to provide the responsive relationships and positive experiences that children need.
4.3 Our community
The LEAP area is home to around 64,800 people, around 2,300 of whom are aged under 4-years-old.6 It is a diverse and culturally rich inner-London community. 70% of residents do not identify as ‘White British’ and 19% of residents speak English as an additional language (40% of 5-year-olds).6 Economic disadvantage impacts the lives of many: 43% percent of LEAP areas are classified as ‘most deprived’, and 68% of children live in ‘very deprived’ areas.7
This context contributed to the inequalities evidenced in outcomes for young children locally. LEAP aims to narrow the inequalities gap and see improved outcomes for all children. It is also of note that Lambeth has a transient population, with families frequently moving in and out of the LEAP area. The Office for National Statistics (ONS) estimate that in 2020 Lambeth had the third highest rates of internal migration of any local authority in England, and the highest rates in London.8 In 2020, Under-5s and 30–44-year-olds were the age groups found most likely to be leaving the borough.8
5.0 LEAP’s engagement aims
Evidence shows that participation in early years services is particularly beneficial for children facing disadvantages (for example, children from low-income families, children in care, disabled children and children with special educational needs) but uptake among these families is lower than average.1 If services do not effectively engage with families, there is a risk that the development and education gap between children from better-off families and their disadvantaged peers may widen (Marmot et al., 2010).2
Outreach and engagement with local families is a core aspect of the work of LEAP’s services and is represented in our programme Theory of Change (see Figure 2). Domain 8: Effective outreach and engagement across all target groups, highlights how engagement underpins the success of all other domains, and enables us to achieve our overall intended impact. As part of its whole system approach, LEAP aims to use effective outreach practices to engage with families at higher risk of poor outcomes and work to identify and remove barriers to accessing services.
5.1 LEAP’s engagement aims
We define engagement as families’ interaction with LEAP services or activities.
LEAP’s engagement aims are:
- Engage families, with children aged 0-3, and expectant parents, with LEAP activities and services
- Sustain family engagement with LEAP – for continued attendance of a service, and the uptake of multiple services
- Connect families to further provision and support outside of the LEAP offer
Throughout all the above, we aim to particularly engage families from LEAP’s priority population.
LEAP’s priority population
LEAP’s priority population refers to families who live in the LEAP area who are from Black, Asian and Multiple Ethnic Groups and/or live in more deprived areas in Lambeth.
The area where LEAP works was selected based on evidence of local need and greater inequalities for young children in these areas compared with the rest of Lambeth. We know that even within this area, there are disparities in wealth, opportunity, and outcomes between different groups of people. Similarly, we know from national evidence that families facing more disadvantages are less likely to access early years offers.1 Therefore, by identifying a priority population we operationalise our intention to reach and support those families less likely to access support and at a higher risk of poor outcomes.
LEAP attempted to develop nuanced measures for Socioeconomic status (SES) indicators that were relevant to child outcomes to help monitor our reach and impact in this way. However, they proved challenging for services to collect routinely and didn’t feel directly relevant to services because the information being collected went beyond demographics. In lieu of more nuanced indicators and given the poverty profile and diverse makeup of the local population, we focus on whether families live in the LEAP area, local area deprivation and ethnicity as proxy indicators. This is sometimes supplemented by analysis of additional factors such as home language and country of origin.
Whilst many LEAP services have specific eligibility criteria beyond reaching LEAP’s priority population, by defining and monitoring our engagement of a priority population across the programme we can assess whether services and activities have been accessible, welcoming, and appropriate for the local community.
5.2 Engagement approaches
The LEAP portfolio has included 22 services focusing on a variety of outcomes across three areas of early childhood development as well as serving different age groups and a holistic range of needs. Within these services there are different eligibility criteria. Services can be divided into three categories:9
- Universal: These are services available to all people within the population.
- Targeted: These are services with eligibility criteria, for example families with a certain vulnerability or need.
- Specialist: These services provide clinical support to address identified conditions.
For a breakdown of all of LEAP’s services and their eligibility criteria, see Appendix 3 in LEAP’s 2021-22 Annual Learning Report.10
There are a variety of mechanisms for family engagement with LEAP services:
- Direct recruitment by the service
Some LEAP services will recruit families directly. One example is our Community Activity and Nutrition (CAN) service, who receive details of eligible women through the local maternity dataset and can contact them directly. - Referrals (from LEAP and non-LEAP partners)
Referrals are formal links, where a person’s contact details are passed on to a service with their consent. Service providers can then contact the individual and invite them to participate in the service. LEAP services may refer to one another, or referrals may come from the wider early years workforce and LEAP. In some cases, families can refer themselves into a service. LEAP’s targeted and specialist services may be more likely to require referrals for a family to take part. - Signposting is a more commonplace approach to family engagement
This happens through word of mouth and other informal channels of communication such as at community engagement events, leaflets and social media. Signposting allows people to learn about a service and decide if they would like to sign up. - Engagement of practitioners and settings
This underpins LEAP’s engagement approaches more broadly. For LEAP’s settings-based services, engagement of families is preceded by the engagement of local early years settings to take up and embed a LEAP service.
Engagement data
The data analysed here come from LEAP’s Integrated Data Platform. When signing up to a service or activity for the first time, families are asked to complete a short registration form which collects demographic information about children and parents or caregivers. They are then assigned an ID in our data platform.
We can link engagement data entries from different services and activities across the programme to see how unique individuals, and families, are accessing LEAP services. To learn more about LEAP’s Integrated Data Platform see Appendix 4 in our first Annual Learning Report.11
Unless otherwise stated, the data analysed in this report was collected between 23 November 2015 which is when the first engagement data was recorded and 31 October 2023 which was the cut-off date for this piece of research.
6.0 Overall reach figures
Over the lifetime of the programme LEAP has reached a total of 15,374 families including (see Figure 3):
- 14,028 children
- 15,254 adults
LEAP has engaged an estimated two thirds of children from the LEAP area under 5-years-old since the beginning of the programme.4
Additionally, LEAP has delivered 208 training sessions, seminars, or webinars to 1,807 early years practitioners working in Lambeth or neighbouring boroughs.12

Figure 4 shows the steady increase in engagement with LEAP services and activities from the beginning of the programme in 2015 to 2021. The slight dip in this increase in 2020 relates to the beginning of the COVID-19 pandemic and the first national lockdown.
In 2021, LEAP’s portfolio of services and activities were at their peak, since then, a gradual decline represents the slow winding down of the programme, as we work towards closing and transitioning services by the end of 2024.
The decline in engagement may also have been impacted by external shocks including the ongoing impacts of the COVID-19 pandemic, the cost-of-living crisis and the decreasing birth rates locally.13
7.0 Barriers and Enablers to family engagement
There are various reasons why families might be unable or unwilling to access LEAP’s services and activities or barriers that make continued engagement difficult. Previous research has shown that certain groups are less likely to engage with early years services than others and a variety of frequently reported barriers to engagement have been identified.14 These include physical and practical barriers such as families’ lack of awareness of services or inability to access them due to transport costs as well as social barriers such as families feeling services were stigmatising them, services did not appeal to them, or they lacked the confidence to attend.15
To build an understanding of some of the drivers of the patterns of family engagement with LEAP, we conducted seven qualitative interviews with core team members responsible for service management and delivery across the LEAP programme. For more details on the methodology used see Appendix B.
Interviews provided insights into:
- the perceived factors which challenged families’ initial and sustained engagement with LEAP services and activities
- some of the approaches being used across the programme to address these barriers and support family engagement
These factors were grouped into five broad themes:
Raising awareness of LEAP: Local families need the right information delivered clearly to understand the services and activities that LEAP offers and how they can be accessed. (See section 9)
Outreach and recruitment capacity: Intentional outreach and person-centred recruitment supports the engagement of families, but service teams need ring-fenced time and capacity to do this. (See section 11)
Responsive and flexible provision: Families are more likely to keep engaging with services that are responsive and flexible to their feedback and needs. (See section 13)
Accessibility of services: services and activities should be delivered in local, accessible spaces to ensure all families can engage. (See section 15)
Trusting Relationships: Families are more likely to engage with services and teams who they feel they can trust to deliver high-quality, and safe provision. (See section 17)
Each of these themes are explored in more detail throughout the report.
8.0 LEAP’s priority population
8.1 Key findings
- Analysis of our engagement data found families engaging with services are broadly representative of LEAP area and priority population.
- Services are set up to operate primarily within the LEAP area and be welcoming and accessible to the local community. Findings suggest that this approach has achieved its aims.
8.2 Background
This section seeks to explore how effective LEAP’s approaches to engagement have been at reaching specific families living in the LEAP area. LEAP intends to engage families living in the LEAP area and prioritises engaging families from Black, Asian and Multiple Ethnic backgrounds and/or those living in the most deprived areas of Lambeth (measured using localised Indices of Multiple Deprivation (IMD), 2019 scores).
The purpose of defining a priority population across the programme is to deliver accessible and welcoming services and culturally appropriate activities for the local community. Though it is important to note that many LEAP services have specific eligibility criteria, meaning that not all children and families are expected to access the programme.
We wanted to understand more about any differences between those families engaging and not engaging with LEAP services. To do so we conducted analysis using local administrative data collected by Health Visitors as the core population for analysis. The Health Visiting service is a statutory service delivered by Evelina, part of Guys and St Thomas’ NHS Trust, who provided LEAP with this data.
With LEAP’s Data Integration Platform (the platform), we have been able to integrate LEAP engagement data with Lambeth’s health visiting (HV) dataset. This means that, through a pseudonymised approach, we can link children in the health visiting records to any LEAP service engagement they have recorded.16
Definition: Pseudonymisation
Pseudonymisation is a technique where we swap identifiable data for nonidentifiable data via an algorithm which provides consistent results even from different locations.
The data included in this analysis dates from April 2015 to September 2023. There are over 45,000 child health visiting (HV) records for this time period.
All child HV records on the platform and corresponding user data were linked to LEAP engagement records either for the children themselves, or for their parents or carers. This linkage provided a basis to record family engagement status. The linked engagement records represent a sub-set of LEAP’s total service and activity engagement, in part due to the variation of linkage rates across services and activities, and in part due to some exclusions when looking at more ‘direct’ engagement.
Priority population criteria described above were applied to the child-level data, and analysis was carried out to determine whether LEAP was more or less likely to engage children in this population. The diagram below demonstrates the data flow relevant to this analysis.
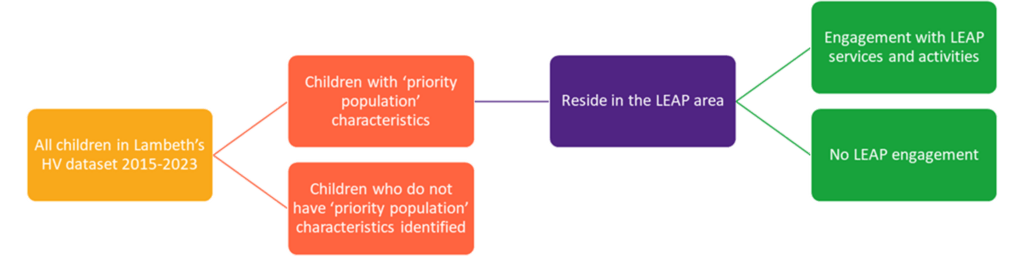
Of the 45,600 children in the health visiting database, 27,100 children had characteristics which aligned to the priority population LEAP services were intended to reach. Within this subset of children, approximately 5,100 lived within the LEAP area at the time of their health visiting appointment. Within this group, we were able to identify those who engaged with LEAP and those who did not engage with LEAP to compare any differences in characteristics.
8.3 Findings
When looking at the population characteristics for LEAPs priority population, descriptive analysis of demographic data shows that 59% of children under 5-years-old from the LEAP area are from a Black, Asian or Multiple Ethnic Group background and that 45% of children under 5-years-old from the LEAP area live in the most deprived 20% of Lambeth areas.
Analysis of linked HV and LEAP engagement records found that 78.9% of children whose family participated in a LEAP service had characteristics consistent with LEAP’s priority population criteria. 77.1% of children whose family had no record of engagement with LEAP services had characteristics consistent with LEAP’s priority population criteria (see Figure 7).

A logistic regression analysis17 looking at whether engagement with a LEAP service can be predicted by LEAP’s priority population criteria found this not to be the case: children from the LEAP area were no more or less likely to have family engagement with LEAP services if they had characteristics consistent with LEAP’s priority population criteria, than those without these characteristics.
8.4 Conclusions
While the results here state relatively neutral findings, it’s worth placing them in context with the demographics described above. LEAP’s engagement with our priority population is consistent with the demography of young children from the area between 2015-2023; this indicates that the programme has proportionately engaged the local community.
Since the LEAP programme began in 2015, several events and shifts in the socio-political landscape have provoked challenges for service and activity delivery and engagement. These issues include, but are not exclusive to, cuts to local authority budgets a significant decline in birth rates, the COVID-19 pandemic, and substantial increases to the cost of living in the UK.18 19 13
While most of these challenges have had a national and international impact, the LEAP priority population is more likely to have experienced greater adversity in recent years than other areas, both locally and nationally, and this may translate to engagement with services.20 21
Faced with unprecedented delivery challenges during the COVID-19 pandemic, and the challenges experienced by the local community such as steep rises in the cost of fuel, food and rent, LEAP has continued to strive for the highest quality service delivery that can meaningfully engage the local community.
LEAP services are set up to operate primarily within the LEAP area and be welcoming and accessible to the local community. Findings suggest that this approach has adequately achieved its aims throughout some difficult times.
Over the lifetime of the programme, LEAP has engaged an estimated two thirds of children from the LEAP area under 5-years-old. If children with priority population criteria are the local majority, and we have reached such a considerable proportion of the local community, it’s fair to suggest that LEAP has been successful in its intention to particularly engage families from LEAP’s priority population. Ultimately, we expect this model of engagement to contribute to LEAP’s two overarching aims.
9.0 Raising awareness of LEAP
A key theme from qualitative interviews with LEAP team members around what enables successful engagement was the importance of delivering information about services clearly with families so they understand the services and activities that LEAP offers and how they can be accessed.
Why is it important?
It was felt that having a visible presence within the local community, both online and physically, creates a sense of familiarity with LEAP as a programme, which in turn supports trust. If families have accurate information and understand the services and support available to them, this enables them to sign up or refer themselves into services that respond to their needs. Similarly, familiarity with LEAP supports the success of signposting and referrals from other services or practitioners as families will be more likely to act on a recommendation.
A review of the literature on the usage of Children’s Centres in England found that a key barrier to families’ engagement was a lack of knowledge and awareness about what was available to them and in some cases a perception that the Children’s Centres were “not for me”.22
What does LEAP do?
LEAP works to build families’ awareness and understanding of the services and activities on offer, and what they are eligible to access. LEAP has a consistent brand ‘identity’ which allows families to easily recognise when something is part of the LEAP offer. Communications around LEAP’s services and activities are written in engaging, accessible language that speaks to families’ needs. Imagery used in communications is representative of the local population and is tailored when trying to reach a certain group (e.g. photographs of fathers attending a session where the service is intending to reach local fathers).
LEAP also works to promote awareness and understanding amongst local practitioners and service delivery partners. If practitioners have up-to-date knowledge and awareness of what is on offer, they are better able to make appropriate signposts or referrals for families. Frequent newsletters are shared within the LEAP practitioner network with updates about the services on offer for families. Workforce events and networks help build mutual understanding of different services. Some practitioners attend other sessions to become familiar with service content and the families taking part to help support referrals or signposting between services.
Marketing the LEAP programme is not without its challenges. LEAP has a wide array of services and activities on offer which can run the risk of overwhelming families with too many options. Similarly, some services and activities that run along similar themes may end up ‘competing’ for families’ attention. All this is in the context of families already being exposed to a huge amount of information and messages in their daily lives.
However, LEAP’s communications to both families and practitioners are strategically planned and timed to help reduce noise and increase their effectiveness. This includes targeting communications when necessary to reach certain groups of families and an integrated communications approach that makes use of multiple channels to reinforce messaging and increase the likelihood that families will engage. Previous research undertaken by the Early Intervention Foundation on the uptake of early childhood services found that using targeted communications for specific population groups was an effective strategy for recruiting parents and carers into services.23
To read more about LEAP’s marketing and communications programme, see our report ‘Community Engagement in a Diverse Inner-City Area’.24
10.0 Families living outside the LEAP area
10.1 Key findings
- Families from non-LEAP areas are a large part of LEAP’s overall cohort. 50% of families who have accessed LEAP services or activities live outside the LEAP area, while 43% live in the LEAP area. The remaining 7% of families did not have residence data on LEAP’s Integrated Data Platform.
- However, families from outside the LEAP area generally engaged with fewer services and fewer sessions per service than families from the LEAP area. 33% of attendances at service sessions, activities, or events were from families living outside the LEAP area, whilst 63% were from families living inside the LEAP area.
- The top three services or activities accessed by these families are Breastfeeding Peer Support, Natural Thinkers – Stay and Play, and Community Engagement activities.
10.2 Background
The LEAP area is an area of Lambeth (see Figure 1). This area was selected based on local need, drawing on a range of local evidence that illustrated greater inequalities for young children in these areas compared with the rest of Lambeth. Broadly, our target area stretches from Stockwell to Myatt’s Field, down through North Brixton to the top of Tulse Hill, covering about 20% of the borough.
When families engage with LEAP services their postcode is checked to see if they fall inside or outside the LEAP area. In the first LEAP Annual Learning Report3, we reported that significant proportions of certain groups (50% of children aged 0-3-years-old and 48% of parents and carers) engaging with LEAP services and activities were living outside the LEAP area.3 We wanted to find out more about the engagement and characteristics of the families from outside the LEAP area who are accessing our services.
10.3 Findings

Participants of LEAP services and activities who were living outside the LEAP area were more likely to be White and less likely to be Black than participants living in the LEAP area (see Figure 8). Across Asian, Mixed and Other ethnic groups the families accessing LEAP services were fairly similar. However, for families living both in and outside the LEAP area, White families were overrepresented and Black families were underrepresented in comparison to the local population.25

Participants who lived inside the LEAP area were more likely to be from the most deprived areas, IMD quintile 1, than those who lived outside the LEAP area. Participants from outside the LEAP area were more likely to be from the least deprived areas, IMD quintiles 4 and 5, than those who lived in the LEAP area.
Definition: Indices of multiple deprivation (IMD)
Indices of multiple deprivation (IMD) is a measure of relative deprivation for small, fixed geographic areas of the UK. IMD classifies these areas into five quintiles based on relative disadvantage, with quintile 1 being the most deprived and quintile 5 being the least deprived.
LEAP’s place-based approach ensures that services and activities are delivered in locations accessible to our priority population. This includes making sure services are based near, or within, areas of greater deprivation. It could be that the families living outside the LEAP area who were accessing services lived in less deprived areas, because those from the most deprived areas are more likely to face barriers to accessing services, such as the cost of travel.
Of the families who have accessed a LEAP service or activity, the number living in the LEAP area is slightly lower than the number living outside the LEAP area.26 However, because families can engage with multiple services and different numbers of activities or sessions within each service, it is important to consider these other metrics when thinking about how much of LEAP’s engagement comes from families outside the LEAP area.
In these cases, families from non-LEAP areas account for 43% of all service enrolments and 33% of all sessions attended. This compares to 52% and 63% for families from the LEAP area, respectively. These figures indicate that families from non-LEAP areas are a large part of LEAP’s overall cohort, but that they generally engaged with fewer services and fewer sessions per service than families from the LEAP area (see Figure 10).
T-tests for difference in means confirm that families residing in the LEAP area use an average of 1.7 services compared to an average of 1.2 for families outside the LEAP area.27 Additionally, families in the LEAP area attend an average of 10.3 sessions or activities per service compared to 6.5 for families outside the LEAP area.
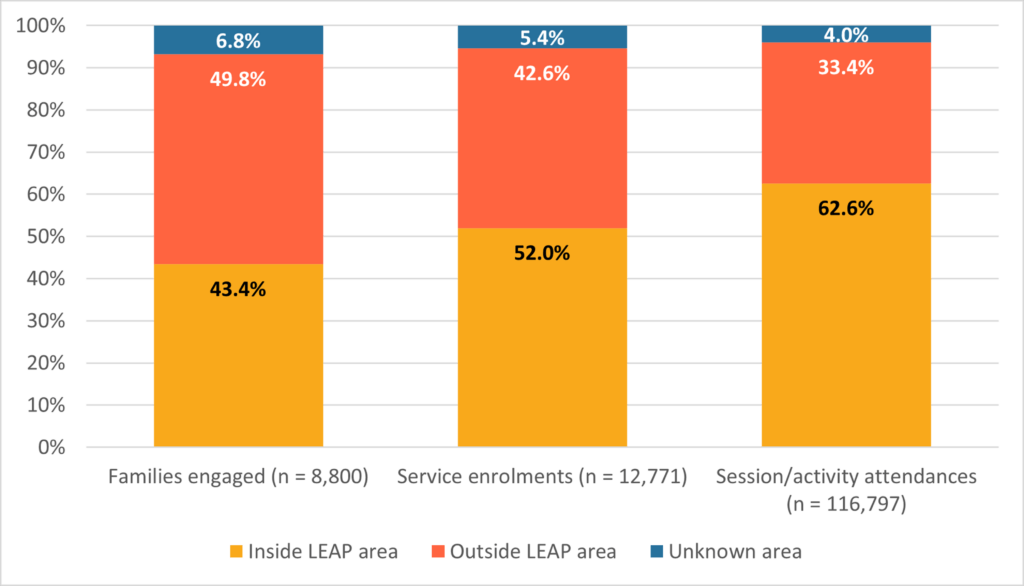
Table 1 below shows the percentage of families engaged with LEAP services, by area.
| Service name | LEAP area | Non-LEAP area | Unknown area | All areas |
|---|---|---|---|---|
| Breastfeeding Peer Support | 22.7% | 43.5% | 28.5% | 33.5% |
| Natural Thinkers – Stay and Play | 13.8% | 19.4% | 9.4% | 16.3% |
| Community Engagement Activities | 18.0% | 13.0% | 19.0% | 15.6% |
| Speech and Language – Chattertime | 14.1% | 9.2% | 8.8% | 11.3% |
| Oral Health – Supervised Toothbrushing | 8.6% | 9.0% | 7.7% | 8.8% |
| Healthy Living Platform | 9.1% | 6.2% | 12.0% | 7.8% |
| Speech and Language – Evelina Award | 5.2% | 4.5% | 1.3% | 4.6% |
| Circle of Security | 1.3% | 2.6% | 0.7% | 1.9% |
| Parent Champions – Volunteers | 1.0% | 2.5% | 1.3% | 1.8% |
| Family Nutrition – HENRY | 1.7% | 1.5% | 1.2% | 1.6% |
| Sharing REAL with Parents | 2.5% | 1.5% | 1.2% | 1.9% |
| Making it REAL | 6.6% | 1.4% | 6.1% | 4.0% |
| Community Activity Nutrition | 17.2% | 1.3% | 2.9% | 8.3% |
| EPEC – Being a Parent | 0.6% | 1.3% | 0.2% | 0.9% |
| EPEC – Baby and Us | 0.8% | 1.1% | 0.5% | 0.9% |
| PINE | 1.9% | 1.1% | 4.5% | 1.7% |
| PAIRS – Together Time | 1.5% | 0.9% | 1.9% | 1.2% |
| Baby Steps | 13.0% | 0.8% | 3.2% | 6.3% |
| Supporting Babies Next Steps | 1.3% | 0.8% | 0.3% | 1.0% |
| Doorstep Library | 3.8% | 0.7% | 1.0% | 2.0% |
| PAIRS – One-to-One | 3.7% | 0.5% | 0.7% | 1.9% |
| CoCreate Fund | 1.3% | 0.5% | 0.2% | 0.8% |
| Caseload Midwifery | 1.7% | 0.4% | 0.5% | 1.0% |
| Natural Thinkers | 16.6% | 0.1% | 2.0% | 7.4% |
| Overcrowded Housing | 4.2% | 0.1% | 0.2% | 1.9% |
| Domestic Abuse – Enhanced Caseworkers | 1.5% | 0.0% | 0.7% | 0.7% |
10.4 Conclusions
A large proportion of the families attending LEAP services and activities live outside the LEAP area. There are a variety of possible explanations for this.
Firstly, some of the most commonly used services by families living outside the LEAP area are universal services such as Breastfeeding Peer Support that are offered borough-wide. Other highly-used services by these families are those based in early years settings, such as Natural Thinkers where participation is based on children attending the setting, whether they live inside or outside the LEAP area (see Table 1).
Another possible explanation is that Lambeth has a transient population; we know that families are likely to have moved in and out of the LEAP area but may have continued to access the services and activities that they are familiar with and enjoy.28
As a 10-year test and learn project funded by the National Lottery Community Fund, LEAP has benefitted from having resources not widely available to other early years initiatives. We know that programmes like LEAP are not on offer in neighbouring areas, high levels of service and activity attendance from families from outside the area could also be an indication of the appetite for similar services more widely.
Finally, although many LEAP services prioritised serving families living in the LEAP area, we recognise that families’ lives are not defined by these spatial boundaries and in many cases, families were not turned away from accessing a service or activity on the grounds that they lived outside the LEAP area. This is one of the intricacies of delivering a place-based programme.
11.0 Capacity for recruitment
A key theme from qualitative interviews with the LEAP team was the recognition of the time and effort needed to support the recruitment and engagement of families into services and activities. See Appendix B for methods used.
Why is it important?
Whilst all services aim to engage families, and marketing within the community is important for raising awareness and supporting engagement, the LEAP team have learnt that getting families through the door requires a considerable amount of time and effort.
The team noted that recruiting families into services isn’t always straightforward. It may require multiple attempts to engage and having the flexibility to have exploratory conversations with families. Therefore, having ringfenced capacity for recruitment activities, and a named individual responsible for this, has a significant positive impact on family engagement with services.
Giving a staff member the time and space to become a familiar and trusted face within the community supports service engagement rates. It also allows service providers to talk with families to explore their needs and answer any questions they have about the service before signing up or accepting a referral.
LEAP staff who were interviewed said that recruitment based on personal interaction was much more effective than more indirect approaches such as sending out flyers or newsletters. This was seen as particularly true for more sensitive services such as mental health services.
Indeed, research on the Early Years Healthy Start scheme found that women who were introduced to the scheme by a professional who was able to take the time to explain the offer and its benefits were more likely to make use of the scheme.29
How does LEAP do it?
In response to the difficulties faced by practitioners in recruiting families into their services, LEAP introduced a Community Connector role. Based in the Community Engagement team, the Connector worked closely with LEAP services with a remit to engage new families with the broad LEAP offer and to have a visible presence in the community.
The Connector regularly visited LEAP engagement activities, service sessions, local children’s centres and other externally run activities and had the time and resources to connect with parents and carers to explore their needs and signpost them to LEAP services or activities. To read more about LEAP’s Community Connector, see our report ‘Community Engagement in a Diverse Inner-City Area’.30
Within service teams, individualised and bespoke approaches to recruiting families have been developed. Practitioners drop in to other services, Children’s Centres and local events to meet families face-to-face and explore their needs and if suitable, invite them to come along to their sessions. Some services also offer introductory sessions or exploratory phone calls that allow parents and carers to get a taste for a session before beginning a service. Unfortunately, it was noted that many services don’t have the capacity or resources to invest in this level of intentional recruitment.
For some of LEAP’s more sensitive services, approaches to engagement are even more flexible. LEAP’s Domestic Abuse – Enhanced Casework service follows a client-led approach to engagement using multiple routes for recruitment including softer touch, women’s advice surgeries where clients can explore their needs and begin to build relationships with the service.
In LEAP’s settings-based Communication and Language Development (CLD) services, service leads faced the challenge of engaging settings to take up and embed LEAP services. Having the capacity to build relationships with settings managers was key to engagement, service leads were able to understand the priorities of settings and in turn build a bespoke offer that fit their needs, encouraging them to get on board.
12.0 LEAP’s community engagement programme
12.1 Key findings
- Community Engagement activities or events were the first contact with LEAP for 13.3% of families who engaged with LEAP between (June, 2017 and January, 2023).
- Of these, 23.1% went on to access LEAP services. Families from LEAP’s priority population were 2.4 times as likely to continue engaging than families not from the priority population.
- Families whose first contact with the LEAP programme was through community engagement activities engaged with more LEAP services on average compared with families who first engaged with the LEAP programme through other routes.
- These families also engaged with an average of 21.9 sessions per service, nearly double the number of sessions compared with families who first engaged with the LEAP programme through other routes.
- The three most common services for families to engage with after first engaging through a Community Engagement activity were Healthy Living Platform (24.1%), Natural Thinkers – Stay and Play (14.1%), and CoCreate Fund activities (8.4%).
12.2 Background
A central element of LEAP’s approach to engaging families is the programme of Community Engagement activities which aim to reach and connect families to the more than 20 services on offer. This section looks at data from families’ engagement with CE activities, and the success of this programme as an approach to connecting families into LEAP services.
LEAP’s Community Engagement programme aimed to serve as a front door for LEAP, to help connect with local families, build familiarity and trust within the community and to signpost and refer families into LEAP services in an accessible, welcoming way. They have done this by providing high quality, light-touch activities, and events where families can enjoy themselves, connect with other families and services, and access information.
From the beginning of the LEAP programme (March 2015) to end of 2023 our Community Engagement team delivered 1,839 events and activities reaching 6,782 individuals from 3,110 families.
These events and activities include:
- Keeping-in-touch sessions (regular, small-scale activities in community settings for families);
- One-off events including themed festivals; and
- Designated spaces for parent engagement (such as People in the Lead sessions).
To find out more about LEAP’s Community Engagement programme see our report ‘Community engagement in a diverse inner-city area’.31
Limitations of LEAP’s Community Engagement Data
Community Engagement data analysed in this report comes from LEAP’s Integrated Data Platform.32 Community Engagement data on the platform is a subset of all Community Engagement data, because only records that are sufficiently complete can be uploaded to the Platform, and not all Community Engagement data meets that threshold. The advantage of using the Platform data is that we can link individuals and families who attend Community Engagement events to their engagement with LEAP services, enabling deeper analysis of Community Engagement’s impact.
A representativeness check was run on the sample of Community Engagement data on the platform looking at ethnicity, IMD quintile, region of birth and language. The sample used in this report was found to be representative of the larger data set held by the Community Engagement team.
12.3 Findings
Looking at families’ first engagement with the LEAP programme, 13.3% of families first engaged with a Community Engagement event or activity, whereas 86.7% first engaged with the programme through a LEAP service (see Figure 11).33

Of the 1,013 families linked on LEAP’s Integrated Data Platform who first engaged with LEAP through a community engagement activity (Community Engagement pathway) and who had a known priority population status, 37.2% were from LEAP’s priority population. Of the 7,125 families who first engaged with LEAP through a service pathway and had a known priority population status, 34% were from LEAP’s priority population. A Pearson chi-squared test shows that this difference is statistically significant.34 This suggests that the community engagement pathway is slightly more successful at engaging families from LEAP’s priority population than the service pathway (see Figure 12).
Similarly, a higher proportion of families who first engaged with a Community Engagement event or activity were known to have English as an additional language (EAL) compared with families who first engaged with a LEAP service (76% and 71.7% respectively). Families with English as a first language were more likely to begin engagement with LEAP through a service (28.3%) than through a Community Engagement event or activity (24%). These differences are statistically significant (see Figure 13).35


Service uptake after starting with Community Engagement
After entering LEAP via the Community Engagement pathway, 23.1% of families went on to access a LEAP service (see Figure 14).

Families from LEAP’s priority population were more likely to engage with LEAP services after beginning their journey with Community Engagement than families not from the priority population. In a multivariate logistic regression controlling for the effect of EAL status, parent age, and number of Community Engagement events attended, families in the priority population were 3 times as likely to continue engaging compared with families not in LEAP’s priority population.36
To better understand this finding, additional analysis separated the priority population into its separate components: area of residence, ethnicity, and local IMD quintile . Looking at families from this perspective showed that the higher rates of service usage were likely driven by mixed-ethnicity families (see Figure 16).37


Level of service engagement after starting with Community Engagement
Families who first engaged through Community Engagement events or activities and then accessed LEAP services were more highly-engaged than those who first engaged through a LEAP service.
These families, following a ‘Community Engagement first’ pathway, tend to engage with more LEAP services than families who follow a “service first” pathway. On average these families accessed 1.8 services whereas those who first engaged with LEAP through a service accessed 1.4 services (see Figure 17). This difference is statistically significant38 and represents a meaningful level of enhanced engagement for families who first engaged with LEAP through Community Engagement.
The three most common services for families to engage with after first engaging through a Community Engagement activity were Healthy Living Platform (27.8%), CoCreate Fund39 (15.1%), and Natural Thinkers – Stay and Play (8.9%).
These families also tended to engage with more sessions per service, (see Figure 18), an average of 24.4 sessions per targeted service, which was nearly double the number of service sessions compared with families who first engaged with LEAP through another route (8.2 sessions). This finding was also statistically significant.40 41


12.4 Conclusions
LEAP’s Community Engagement programme has made a positive contribution to families’ engagement with LEAP. Community Engagement events and activities have acted as the front door to LEAP for over 1 in 10 of the families who have engaged with LEAP services.
It is particularly encouraging to see that LEAP’s priority population has been well represented in this pathway, suggesting that Community Engagement events and activities have been appealing and accessible to the families we most wanted to reach.
Our data analysis shows that families who begin with a Community Engagement event or activity go on to be more highly-engaged participants in the LEAP programme, accessing a higher number of services as well as attending more sessions per service. engaging more intensely in individual services.
13.0 Informed, Responsive and flexible provision
In order to be appealing and engaging to local families, LEAP provision should be well-informed, flexible, and responsive to parent feedback and the changing needs of families. See Appendix B for methods used.
Why is it important?
To engage families, and keep them engaged, services and activities should feel appealing and relevant to their needs. In interviews, the LEAP team reflected that services and activities that were informed by evidence and family input were more likely to effectively reach families from LEAP’s priority population and meet their needs.
The importance of adapting services based on family input and feedback was seen as a key factor in supporting the initial and sustained participation of families. If services are felt to be culturally relevant and in tune with the changing needs of families, they are more appealing.
This has been well evidenced: in an Early Intervention Foundation review of early childhood services, researchers found that “designing interventions around the needs, concerns and lifestyles of target populations” and ensuring they are “culturally relevant” was a key strategy for effective recruitment and retention of families in services.42
In research on the usage of Children’s Centres, the Institute of Health Equity found that parents will stop accessing parenting support if they find it stigmatising, or at odds with their world view.22
Crucially, however, the LEAP team recognised that working in this way also requires that service models are flexible and adaptable to changing needs or feedback.
How does LEAP do it?
As part of a test and learn programme, LEAP services are flexible by design and able to make adaptations in response to parent feedback or emerging evidence. Service review processes include routine reflections on monitoring and impact data as well as opportunities to discuss possible changes to service delivery.
Monitoring of engagement data allows services to see which groups of people are engaging most or least. This can inform marketing and recruitment efforts to reach underrepresented priority populations.
Monitoring of routinely collected feedback from families also guides service adaptations and developments. We present an analysis of family feedback data from recent years later in this report (See section 14). One challenge we have faced in monitoring family engagement is that LEAP has not routinely gathered data on referrals and signposting between services, which has limited our ability to test and learn in this area.
The voices of parents and carers have informed the development of the LEAP programme since its inception. More recently, mechanisms for gathering input from local parents and carers have been formalised through the People in the Lead Sessions.
In formalising these sessions, such as by compensating participants for their time and providing creche and refreshments, parents and carers are empowered to take part feeling their time and views are respected and valued. To read more about LEAP’s People in the Lead sessions, see our recent report.43
The COVID-19 pandemic required LEAP to adapt the programme to meet the changing needs of families. In 2020, LEAP carried out research to explore how the pandemic was changing the needs and experiences of families in the LEAP area and to document how LEAP services were adapting their provision.44 Many of LEAP services adapted their delivery to online to be able to continue to support families throughout lockdowns.
Similarly, in response to the recent Cost of Living crisis, and on hearing about the increasing challenges local families were facing over the winter, LEAP delivered a series of ‘Warm Hub’ events, offering families respite through a whole day of activities, hot food, and socialising in a warm, welcoming space.45
There were, however, limits to how much we could adapt our services and activities to meet the needs of families. We recognised that some areas of support were beyond our scope of early childhood development, and that the sheer level of need for local families was increasing.
14.0 Families rate LEAP services and activities very highly
14.1 Key findings
- Feedback on LEAP’s services and activities is consistently very positive.
- Families strongly agreed that LEAP services were welcoming and that practitioners were trustworthy, helpful and knowledgeable.
- Most families report having learnt something new as a result of attending services and nearly all participants report having had a positive experience of LEAP.
- When asked what was particularly good about LEAP services, families highlighted that services were a safe space for sharing and learning, and that they enjoyed the opportunities to connect with other families.
- In terms of what could be better, most feedback was around wanting more frequent sessions, longer sessions or sessions to be offered at different times.
14.2 Background
LEAP aims to provide high-quality early years services where families feel welcome and safe and where practitioners are trustworthy and helpful. The quality of provision is a key driver of family engagement and LEAP routinely gathers family feedback about their experiences of services and activities to monitor quality.
This section provides updated analysis of our feedback data, previously presented in the first Annual Learning Report.3 This section draws on feedback data for 13 services as well as Community Engagement activities.46 It analyses 1,383 responses to LEAP’s Family Feedback Form that were submitted between April 2022 and October 2023.47
To encourage open and honest responses, the Family Feedback Form is anonymous, but respondents are asked for their home postcode and ethnicity to help with equalities monitoring. Further detail about feedback data collection and analysis can be found here.48
14.3 Findings
Characteristics of family feedback respondents
When completing the Family Feedback Form, in 1,273 (92%) responses, respondents disclosed their ethnicity. The most common ethnicity indicated in feedback responses was ‘White’ (42.1%), followed by ‘Black, African, Caribbean or Black British’ (28.8%).
This is comparable to the profile of adults who have accessed LEAP services, of whom 54% were White and 28% were Black, African, Caribbean or Black British, suggesting that in terms of ethnicity, feedback data is broadly representative of families accessing LEAP services and activities.
In 1,199 responses, respondents gave a valid postcode, from which we can find out the deprivation score of their home area, and whether they live in the LEAP area. Analysis showed that 58.3% of responses were given by participants who lived in the LEAP area, whilst 36.1% were given by participants who lived in non-LEAP area and 5.6% by those who lived outside Lambeth. 81% of responses were given by participants living in more deprived areas.49
Of all LEAP service participants, around 54% live in more deprived areas, which means that the sample group’s IMD does not entirely reflect the deprivation distribution in the LEAP population.
Response bias
When analysing feedback data, we found that there were a couple of instances of response bias in the results:
- Participants whose postcode was complete were more likely to give more positive feedback.
- Participants who disclosed their ethnicity were more likely to report that they strongly agreed with a statement compared to those who didn’t.
14.4 What do families like or dislike about LEAP services and activities?
Feedback about LEAP services and activities continues to be very positive
Service participants were asked seven questions about their experience. The sample size ranges between 1,153 and 1,193 responses for each question.
In the majority of responses, respondents strongly agreed that LEAP services were welcoming (92.7%), and that LEAP staff were knowledgeable (88%), helpful (90.3%) and trustworthy (85.6%). In fewer responses, respondents strongly agreed that staff understood their family’s needs (78.7%) or that they learnt something new from the service (79%), but the majority still agreed with these statements (see Figure 19). This is in line with findings from the previous Annual Learning Report analysis.50

Most respondents would highly recommend LEAP services and activities to their family or friends
Respondents were asked how likely they were to recommend the service to family or friends, on a scale from 0 to 10, with 0 being ‘not at all likely’ and 10 being ‘extremely likely’. The recommendation score is used to calculate a ‘net promoter score’ (NPS), a widely used market research metric. Overall, 89% of respondents were classified as promoters and only 2.6% were detractors, giving a total NPS for LEAP services and activities of 86.4. This shows an increase over the last two years and is considered an excellent score.51
Do the experiences of families from LEAP’s priority population differ from those of other families?
There was no significant variation between families from different ethnic groups when asked about overall experience of attending a service.
When looking at the responses given by families from different ethnic groups, ‘Mixed’ and ‘white’ ethnicity participants were slightly more likely to strongly agree (90.2% and 91.8% respectively) that their overall experience of attending a service was positive, compared to 88.2% of ‘Other’, 86.2% of ‘Asian’ and 85.1% of ‘Black’ ethnicities. However, when looking at differences between ethnic groups who strongly agreed or agreed with that statement, there was no variation.
Responses given by participants from more deprived areas were more likely to report that they had learned something new, compared to responses given by participants from less deprived areas.
Around 80% of responses given by participants from the most deprived areas (IMD quintiles 1, 2 and 3) strongly agreed that they learnt something new because of attending a service. Responses given by participants from less deprived areas were less likely to strongly agree with the statement, with 65% of those in IMD quintile 4 and 40% of those in quintile 5 strongly agreeing (see Figure 20).

What do families like or dislike about LEAP services and activities?
LEAP’s Family Feedback Form also asks two open ended questions: ‘‘What did we do well?’ and ‘What could we do better?’ Analysis of the responses highlighted some recurring themes in families’ experiences of LEAP services and activities, many of which reinforce the positive findings above.
In terms of what LEAP did well, families focused their feedback on the quality of staff, noting that they were helpful, kind, welcoming and knowledgeable. Families also commented on the supportive and safe environment fostered within LEAP services and activities. They reported feeling understood and listened to and that the services provided a non-judgemental and safe space for sharing and learning.
Giving space to talk through experiences and gently guiding the group. Creating a calm atmosphere.
I always feel welcome when I attend the children centre. All staff are warm, friendly and helpful. The session leader is great. I look forward to my yoga class each week. I found out that I was entitled to vouchers for fruit and veg which has been a blessing. I was also provided with items such as maternity pads and pregnancy vitamins, along with energy saving items.
Families fed back on quality of services commending the planning and content of sessions and the accessible and high-quality facilities and resources. When asked what LEAP could do better, families wanted more frequent sessions, longer sessions and more options for timings of sessions.
Very welcoming. I felt very comfortable in every session + always left with new information on parenting. I would have loved to have more sessions with (facilitators).
More of the same please – some afternoon sessions would be great.
Families felt that they had benefited from services and spoke of learning and increased confidence for themselves as parents and carers, and for their children. Regarding what could be better, some families wished they had known about services before, suggesting more effort should go into advertising services locally.
The breastfeeding councillor made us feel welcome and understood our concerns really well. She provided lots of re-assurance and really helpful practical steps for us to take forward with our baby. We’re feeling a lot more confident about how we will work on latching with our baby when we get home.
All activities were child centred, and I found the practitioner allowed opportunities for my son to explore a variety of concepts at his own pace and showed excellent early years practice. As a boy, I think the physical nature of Natural Thinkers also helps as we have seen an increase in fine/gross motor skills.
Very understanding and reassuring & well-informed midwife. – Good join up with other services e.g. hospital team. – Baby Steps class, especially accommodating my partner joining online.
A final theme from families’ feedback was having enjoyed the opportunity to connect with other parents and carers and to find out about and connect with further services and support. When considering what could be better, families requested more time and opportunities to connect with other parents and carers.
It was lovely to meet other parents with children of the same/similar age sharing experiences in a safe space.
It was wonderful overall. I wish we had small ice breaking sessions with other parents. Just to make those connections. I would have loved to know more about the others life but was too shy. It would have been nice to really have some catalyst to talk to each other. The facilitators did encourage us, but it’s about bringing people together.
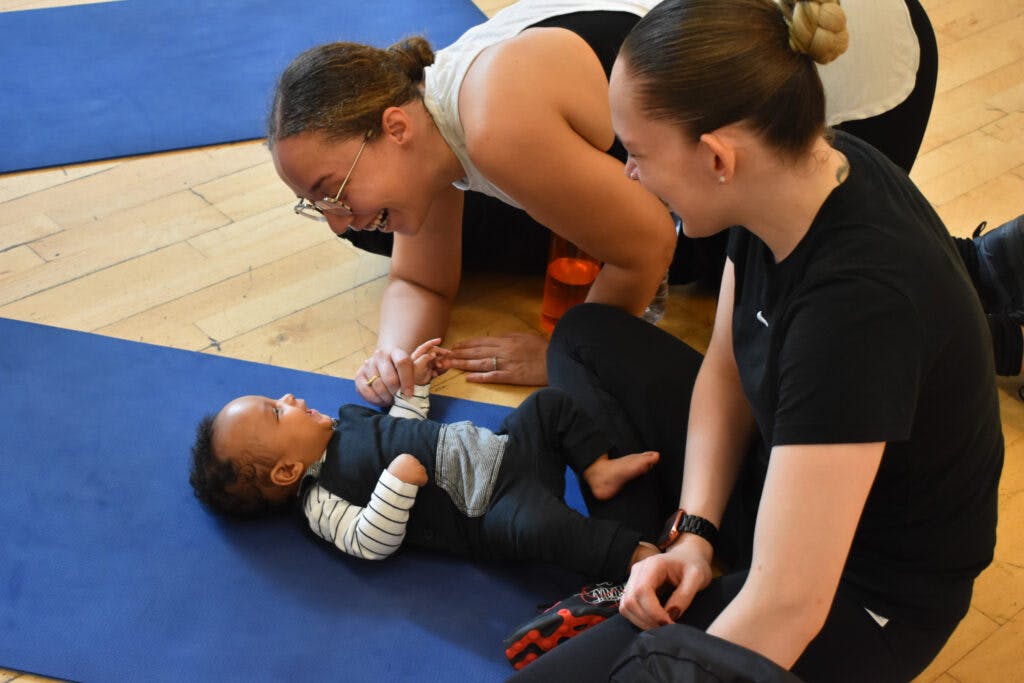
15.0 Accessible and high-quality provision
A key theme from qualitative interviews around enablers to family engagement was the importance of providing services and activities that are accessible and high quality. See Appendix B for methods used.
Why is it important?
It is known that families finding provision inaccessible is a key barrier to engagement with early years services. The Institute of Health Equity reported that transport was a key physical barrier to accessing early years provision, especially for families “reliant on public transport and with pushchairs”.22
Interviews with LEAP team members highlighted the importance of delivering services near to where families live and in good-quality, accessible spaces. Similarly, another common theme was ensuring that services were accessible in their delivery, so that all families can participate and feel comfortable.
How does LEAP do it?
As a place-based programme, LEAP services have all been delivered in local spaces, often at Children’s Centres or other locations that families were already likely to be accessing. We ensured that all service delivery locations were safe and appropriate for families.
Services make efforts to be accessible to all families and, where relevant, offer creche (to allow parent participation in parent-facing services), translation services, and the option to participate online for those unable to attend face to face. Some services have adapted the timing of their delivery. For example, Baby Steps started to offer sessions in the evenings to allow for family members who are working to attend.
It was brilliant that there was a creche and that the course was free.
Recognising that committing to services can be daunting, and that families’ lack of time to take part in a full course of sessions can be a barrier to engagement, LEAP have offered lighter-touch engagement opportunities such as Baby Yoga, Zumba and Festivals which may be easier to access and can introduce families into LEAP gently.
Finally, LEAP aims for all our communication with families to be accessible, including simple language and translated materials where needed, and easy-to-follow instructions on how to find further information or to sign up to a service or activity. Marketing materials and social media promote LEAP’s ‘What’s on’ web page with an Eventbrite page, embedded.
This enables families to find out about activities and book sessions directly at any time. This makes it easier for families to access sessions from a range of providers. To read more about the development of our online booking approach, see our recent report.52
LEAP has faced some difficulties in ensuring all provision is accessible. Sometimes, it has been hard to find and book appropriate spaces for events or activities, and interpretation is not always possible for some services. Some of our services must be accessed through other partners’ websites so LEAP doesn’t have oversight of the accessibility of information or sign-up processes.
16.0 LEAP services and activities positively impact on parents’ knowledge and confidence
16.1 Key findings
- LEAP’s parenting services helped parents and carers to feel more knowledgeable and confident about their parenting.
- LEAP’s Communication and Language Development (CLD) services increased parents’ and carers’ knowledge and confidence around supporting their child’s early communication, language and literacy development. Findings suggests that these services have been particularly beneficial to families with English as an additional language.
- LEAP’s Community Activity and Nutrition (CAN) service helped parents and carers to feel more knowledgeable and confident about leading a healthy lifestyle.
16.2 Background
LEAP services have aimed to equip parents and carers with the knowledge and confidence they need to provide their children with the best start in life. Services focussed on supporting behaviours that have a strong evidence base for their positive impact on children’s long-term outcomes and are grouped into three strands:
- Communication and Language Development
- Social and Emotional Development
- Diet and Nutrition
Improvements in knowledge and confidence are key medium-term outcomes for the LEAP programme and indicate progress towards longer-term childhood development outcomes. They can also provide more insight into families’ experiences of services.
This section provides an analysis of medium-term outcome data for seven of LEAP’s services and is an update to the analysis presented in last years’ Annual Learning Report, looking at data collected between 1 April 2022 – 31 October 2023.
Medium term outcome data
We measure changes in knowledge and confidence through ‘family questionnaires’ which were developed with services. Family questionnaires are self-completed by participants either on paper or online. The forms are not anonymous as the service provider matches the form to the individual so that their data can be uploaded to the platform. Not all services collect medium-term outcomes data.
16.3 LEAP’s services
LEAP’s parenting services
LEAP has funded several services to support parents and carers and enhance their relationship with their child, both before birth and in infancy and early childhood:
- Baby Steps: A nine-week group programme for expectant parents, including 6 antenatal sessions and 3 postnatal sessions.
- Circle of Security Parenting (COSP): An eight-week group programme for parents and carers of children.
At the end of the service, parents and carers attending Baby Steps and Circle of Security Parenting (COSP) answered questions about their attitudes towards and knowledge of parenting, their confidence in parenting, and changes in their knowledge and confidence after taking part in the service. Analysis looked at data from the Baby Steps Family Questionnaire (176 respondents) and the COSP Family Questionnaire (98 respondents) collected between April 2022 and October 2023.
Almost all respondents reported that attending Baby Steps or COSP had improved their knowledge of parenting, with 96.5% of Baby Steps participants and 97% of COSP participants reporting that attending the service had either a positive or very positive effect on their knowledge.
Parents and carers felt particularly knowledgeable about positive parenting techniques, with 94.1% of Baby Steps participants and 92% of COSP participants rating their knowledge in this area as high or very high at the end of the service.
Similarly, almost all parents and carers also reported improved confidence through attending the parenting services. 94.6% of Baby Steps participants and 98% of COSP participants reported that attending the service had either a positive or very positive effect on their confidence around being a parent.
Most parents and carers reported high or very high levels of confidence around responding to their baby’s needs (95.3% of Baby Steps participants and 99% of COSP participants).
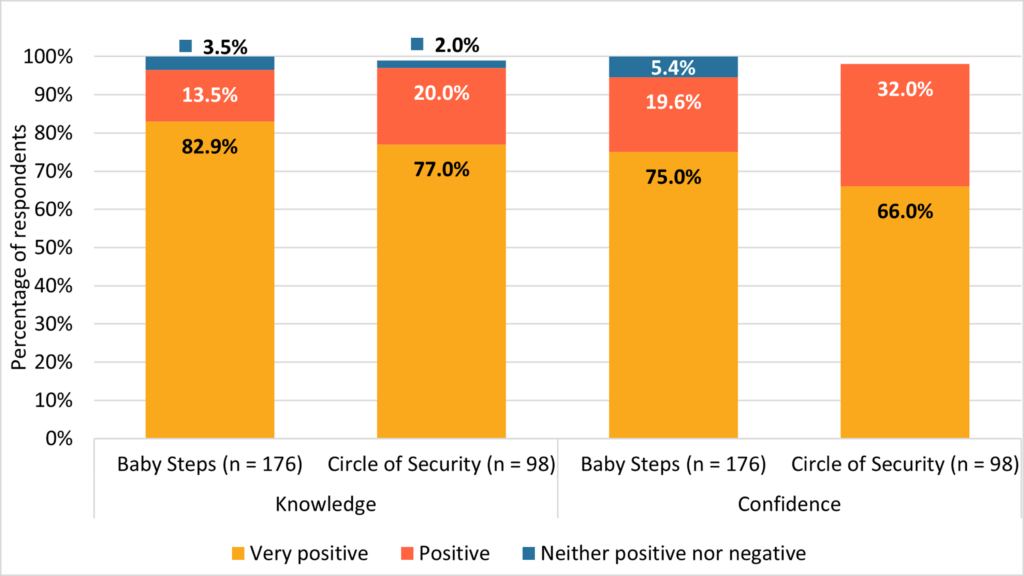
Some participants of LEAP’s parenting courses reported feelings of anxiety about being a parent. For Baby Steps participants, 39.1% agreed with the statement ‘I feel anxious about being a parent’ (35.5% agreed and 3.6% strongly agreed). Of those attending Circle of Security Parenting, 29% agreed that they felt anxious about being a parent (27% agreed and 2% strongly agreed). Around a quarter of Baby Steps and a fifth of COSP participants neither agreed nor disagreed with the statement (see Figure 22).
Experiencing anxiety and stress, to an extent, is a normal part of parenthood and recent years have proved exceptionally challenging for parents and carers of young children, especially those living in deprived areas. Anxiety and stress reported at the end of the programme may indicate cause for concern for some parents and carers. For others, it may reflect that the parenting programme has succeeded in normalising the struggles involved in family life, enabling parents and carers to feel safe and validated when sharing their experiences.

Note: The percentage of Circle of Security Parenting participants who indicated they ‘strongly agree’ that they felt anxious about being a parent was 2%
LEAP’s Communication, Language and Development services (CLD)
Services in LEAP’s Communication and Language Development strand have worked with parents and carers to support their child’s communication and language development and to provide a positive home learning environment:
- Supporting Babies’ Next Steps: A four-session course for parents of babies aged 0 to 1-year-old.
- Sharing REAL: A four-session course for parents and carers of children aged 18-months to 3-years-old.
- Making It REAL: Home visits and direct work with parents and carers with children aged 0-3-years old.
- Natural Thinkers – Stay and Play: Regular sessions at Children’s Centres for families with children aged 0-3-years-old.
Sharing Real and Supporting Babies’ Next Steps
Parents and carers participating in Sharing REAL and Supporting Babies’ Next Steps filled in a Family Questionnaire at the final session, which collected information on their knowledge about, confidence in, and intention to do activities that support a positive home learning environment.
Analysis looked at data from the Sharing REAL Family Questionnaire (35 respondents) and the Supporting Babies’ Next Steps Family Questionnaire (32 respondents) collected between April 2022 and October 2023.
All participants of Supporting Babies’ Next Steps reported that attending the service had a positive or very positive effect on their knowledge about early communication, language and literacy development. Similarly, out of 35 participants of Sharing REAL, 71.4% reported that attending the service had a very positive effect and 25.7% reported that the service had a positive effect.
Almost all participants of both Supporting Babies’ Next Steps and Sharing REAL reported that attending the services had a positive or very positive effect on their confidence in supporting their baby or child’s early communication, language and literacy development.


In last year’s analysis , we reported that LEAP’s CLD services may be particularly beneficial to those families with English as an additional language.
Once again, in this analysis respondents with English as an additional language were more likely to report that the services had a very positive effect on their knowledge and confidence about early communication, language and literacy development compared to those respondents with English as a first language.53 However, the difference was not statistically significant (p=0.525; p=0.433).

Making it REAL
Parents and carers participating in Making it REAL were asked about the impact of the service on their knowledge and confidence in children’s early literacy. Analysis looked at data from the Making it REAL Family Questionnaire 44 respondents) collected between April 2022 and October 2023.
All respondents (44) reported that attending the service had a positive (22.7%) or very positive (77.3%) effect on their knowledge of early literacy. See Figure 26. In particular, parents and carers reported high or very high levels of knowledge about the role a parent can play in supporting their child’s literacy (47.7% and 50.0% respectively, 2.3% reported moderate levels).
Similarly, all respondents reported either a positive, or very positive effect on their confidence in supporting their child’s early literacy development (see Figure 27). At the end of the service all respondents reported a high or very high level of confidence in talking, singing, telling stories or saying rhymes to their child (22.7% and 77.3% respectively).


Natural Thinkers – Stay and Play
Each half term, parents and carers attending the Natural Thinkers – Stay and Play sessions were given a Family Questionnaire which asked them about the effect of attending sessions on their knowledge and confidence around children’s outdoor learning and play.
It also asked parents and carers about the impact the sessions had on their child’s communication and language and their wellbeing. Our analysis looked at data from the Natural Thinkers – Stay and Play Family Questionnaire (65 respondents) collected between April 2022 and October 2023.
Of the 65 parents and carers who responded in this time frame, 77.8% reported that attending the sessions had had a positive or very positive effect on their child’s communication and language (30.2% and 47.6% respectively) (see Figure 28).
Most (91.7%) respondents reported that the service had a positive, or very positive effect on their child’s health and wellbeing (34.9% and 52.4% respectively) (see Figure 29).
The majority of parents and carers reported high or very high levels of confidence in taking their children outside (36.9% and 41.5% respectively) and in supporting their child to learn outdoors (29.2% and 66.1% respectively).


LEAP’s diet and nutrition services
Services in LEAP’s Diet and Nutrition strand have worked with parents and carers to improve their diet and levels of activity during pregnancy and beyond as well as to support improved diet, nutrition and physical activity for their children.
Only one of LEAP’s diet and nutrition services has collected medium-term outcomes data from families:
- Community Activity and Nutrition (CAN) is an eight-week service for pregnant women and birthing people with a BMI above 25.
Community Activity and Nutrition
Analysis looked at data from the Community Activity and Nutrition (CAN) Family Questionnaire (70 respondents) collected between April 2022 and October 2023.
88.6% of the participants (n = 70) reported that taking part in CAN had a very positive effect on their knowledge about healthy lifestyle. 10% reported that it had a positive effect on their knowledge (see Figure 30).
80% of the attendees reported that attending the service had a very positive effect on their confidence in leading a healthy lifestyle, and 81.4% of the group experienced that it had a very positive effect on their intention to make healthier choices. Figure 31.
When asked about particular areas of knowledge, most respondents reported high or very high levels of knowledge about where to find help and advice about their diet (37.1% and 51.4% respectively); fewer respondents reported high levels of knowledge about where to find help and advice about breastfeeding (47.1%), although only 18.6% reported low or very low levels of knowledge about this.


16.4 Conclusions
All seven services analysed in this section have contributed to improvements in parents’ and carers’ knowledge and confidence in areas that will support their health and wellbeing, as well as their child’s early development. The effectiveness of services in making an impact on families is a key driver of sustained engagement.
Families who feel services are making a difference to them or their children will be more likely to continue attending sessions. The Institute of Health Equity found that this sense of direct benefit to parents contributes to their ongoing engagement and involvement in Children’s Centres courses and programmes.22 54
17.0 Trusting relationships
The final theme from this research was the importance of trusting relationships between families, LEAP and delivery partners. See Appendix B for methods used.
Why is it important?
Trust is known to be a key factor in successful community engagement and the importance of trusting relationships was a key theme from interviews with the LEAP team. It is also evident within all the other themes found from the qualitative interviews. A literature review looking at barriers and enablers to participation in early years services found that when programmes build trust and partnership with families, higher levels of engagement are consistently seen.55
If families feel they can trust LEAP providers and services to be good-quality, safe, and relevant to them, then they will be more likely to engage with the offers. Similarly, a trusting environment enables families to express their needs and ask questions about the support they can access.
What is more, trust between services is essential to the success of place-based collective impact programmes like LEAP. Providers of different services and support to families need to be able to trust that other provision is high-quality and suitable for the families they serve.
Building trusting relationships between services and local organisations promotes the use of referrals and signposting so that families can better access the range of provision available to them.
How does LEAP do it?
LEAP recognises that trust is something that is earned and has invested in working to build and maintain trusting relationships with local families and partners.
The previously mentioned themes all contribute to trusting relationships between LEAP and the community. Having a named person with specific capacity for recruitment allows families to build relationships and trust before accessing services.
Delivering consistently high-quality services and activities has earnt LEAP a reputation as trustworthy and reliable, while responding to the feedback and changing needs of families shows that we value families are serious about meeting their needs.
Ensuring that service staff and imagery in marketing materials were representative of the local community was highlighted as an important aspect in gaining the trust of local families. Families are more likely to trust a service if they see themselves reflected in the workforce or in the imagery used.
The literature review on uptake of early years services by the Early Intervention Foundation found that “recruiting practitioners from comparable backgrounds to parents, who speak the same languages, are of the same gender and share similar experiences” was an effective strategy for the recruitment and retention of individuals into services.42
LEAP has tried to ensure that all imagery used in communications and marketing is representative of the local population. For some services, intentional recruitment of workforce and parent volunteers from ethnic backgrounds representative of the LEAP area community, or who spoke the languages, besides English, which are most commonly spoken in the LEAP area has helped to build a representative workforce.
LEAP services have also succeeded in engaging families by building on families’ existing relationships and networks. Families will be more likely to follow up on a referral or signposting from a provider or organisation who they already trust.
At LEAP, the Caseload Midwifery service has been a key source of successful referrals and signposting into more sensitive services such as the Parent Infant Relationship Service or the Domestic Abuse – Enhanced Casework service. Because individuals had already built trusting relationships with their midwives, they could safely explore their needs and were more likely to trust that a referral or signpost would be useful for them.
Partnership is central to LEAP’s model as we understand that no one organisation or service can meet the many needs of local families. LEAP has worked with over 30 local partners and has learnt a lot about how to build trusting and successful relationships.
For a step-by-step breakdown of forming effective partnerships and some examples, see our housebuilding analogy.56
18.0 Sustaining engagement with families
18.1 Key findings
- Excluding families that only engage with Community Engagement events and activities, the majority of families have engaged with one of LEAP’s services (73.1%), while over 1 in 4 families have engaged with more than one service (26.9%), with 9.8% of families having engaged with three or more services.
- Families from LEAP’s priority population are nearly 3 times more likely to engage with multiple services than families not from our priority population.
- Services with the highest linkage rates as a percentage were EPEC – Baby and Us (50%), Caseload Midwifery (43.5%), and Supporting Babies’ Next Steps (43%).
- Services and activities that by volume, link the highest number of families to other services are Breastfeeding Peer Support (n = 363), Speech and Language Evelina Award (n = 326), and Community Engagement activities (n = 325)
18.2 Background
Once they had engaged with a service or activity, LEAP aimed to sustain families’ engagement in two ways:
- Within a service, families repeatedly attend sessions.
- Within the wider LEAP programme, that families go on to access other services.
This section explores LEAP’s effectiveness in sustaining family engagement.
Dosage and Completion
Once a family had engaged with a LEAP service, LEAP aimed to sustain their engagement through continued attendance of service sessions. Most of LEAP’s course-style services aim for all families to attend a set number of sessions to consider them as having ‘completed’ the course. This would mean that a family completed all aspects of a service, were able to receive the full benefits and/or are considered by practitioners to no longer need support from the service.
These same course-style services set a minimum number of sessions that families need to attend for the service to have made an impact. We refer to this as ‘dosage’. Dosage and completion thresholds differ between services, depending on the kind of course, its length and its objectives. See Table 2 for further details.
| Service | Total sessions offered by the service | Dosage threshold | Completion threshold |
|---|---|---|---|
| Baby Steps | 2 home visits and 9 sessions | 6 sessions | 9 sessions |
| CAN (Community Activity and Nutrition) | 8 sessions | 4 sessions | 8 sessions |
| Circle of Security Parenting | 8 sessions | 6 sessions | 8 sessions |
| EPEC – Baby and Us | 8 weekly sessions | 6 sessions | 8 sessions |
| EPEC – Being a Parent | 8 weekly sessions | 6 sessions | 8 sessions |
| PAIRS – Together Time | 6 sessions | 4 sessions | 6 sessions |
| Supporting Babies’ Next Steps | 4 sessions | 3 sessions | 4 sessions |
| Sharing REAL | 4 sessions | 3 sessions | 4 sessions |
| Making it REAL | 4 home visits and 3 events | 3 home visits and 2 events | 4 home visits and 3 events |
Multiple service use
Another key aim for LEAP’s engagement with families was that they would engage with multiple LEAP services. LEAP uses a place-based, collective-impact framework and approach.
This means that LEAP brings together people and organisations to share information and work in mutually reinforcing ways to meet the unique needs of local children and families, and achieve impact on children’s diet and nutrition, social and emotional development and their communication and language development.
This approach is used by LEAP because children’s lives are shaped by a range of multi-level influences which interact, including family, education and care, and social and cultural contexts.
LEAP understands that there are limits to what single initiatives working in isolation can achieve. LEAP services are designed to work as a portfolio of offers which are mutually reinforcing and together, can collectively meet the holistic needs of families with children aged 0- to 3-years-old.
Multiple service use data
LEAP’s integrated data platform allows us to link data across LEAP services. This allows us to see the number of services a family has engaged with, which services they have accessed and when they were accessed.
However, LEAP does not routinely collect data on referrals or signposting. We therefore cannot confidently attribute multiple service use to the signposting, referrals or other efforts made by the LEAP workforce.
18.3 Findings
Dosage and Completion
This analysis looks at session attendance data for LEAP’s course-style services with dosage and completion thresholds.
Of all participants in course-style services, 63.1% attended enough sessions to reach dosage in at least one of these services, whereas 36.9% attended enough to complete at least one of the courses.
There were no significant differences in rates of dosage between families from LEAP’s priority population and families not from the priority population, but families from LEAP’s priority population were slightly less likely to complete at least one course than families not from LEAP’s priority population (see Figure 32).57

(n = 1,371)
Multiple Service Use
As a collective impact initiative, which offers a variety of services which together can provide holistic support for early childhood development, LEAP hopes that families will engage with multiple services.
26.9% of families access multiple LEAP services.5 This equates to 2,124 families engaging with at least two LEAP services at any point from the beginning of the programme up to October 31 2023. The majority (73.1%) of families attended only one LEAP service, excluding Community Engagement events or activities. Just under 10% of families (772 families) engage with more than two services (see Figure 33).
The average family engages with 1.44 LEAP services.

A higher proportion of families from LEAP’s priority population engaged with multiple services compared with families not from LEAP’s priority population. Figure 34 shows the proportion of families that engage with multiple services from the priority and non-priority populations. Multivariate logistic regression confirms that families from LEAP’s priority population are 2.9 times as likely to use two or more services than families that are not from LEAP’s priority population.58
Further investigation of this result indicates that this is mostly driven by the engagement of mixed or multi-ethnic families and families in the LEAP area59. Figure 35 shows that mixed and multi-ethnic families have the highest proportion of families using multiple services.
Figure 36 shows that 40.8% of families living in the LEAP area attended multiple services whereas only 16.6% of families from outside the LEAP area attended two or more services. This makes sense in the context of service eligibility because there are fewer LEAP services which families from non-LEAP areas would be able to access.


Links between LEAP services
In place of accurate data on referrals between services, we can analyse family engagement in terms of which services a family attended and when, or in which order they were accessed. For the purposes of this research, we have called this service linkage.
A family is considered “linked” by service A if, after their first engagement with service A, they go on to attend a session of any other service B. The proportion of families attending a service (A) that go on to engage with any other service (B), rather than ending their engagement with LEAP, is the linkage rate for that service (A). For example, 29.7% of families that attend HLP services will eventually take up another service after attending HLP for the first time.
Linkage between services is not necessarily the result of deliberate efforts by earlier services to signpost or refer service users, although efforts to signpost and refer service users may contribute to higher linkage rates. Table 3 shows LEAP services (including Community Engagement events and activities) by the number of families they “link” to other services.60
Across all LEAP services, the overall linkage rate between services is 31.1%. This means that for nearly a third of all service enrolments across the LEAP programme, the family will go on to enrol in an additional service. This suggests that LEAP has offered a portfolio of services that are well embedded locally, and that families have good experiences encouraging them to return to the programme over time.
There are some services with a high volume of linked families, but low linkage rates. This is the case for the Breastfeeding Peer Support service. As a drop-in and light-touch service, there is a chance that these linkages are due to the sheer volume of service participants, which could suggest that multiple service use is coincidental, rather than being because of a signposting effort.
Other services have low volume of linked families but much higher linkage rates, such as EPEC – Baby and Us, which is a peer-facilitated course-style service where participants and the service practitioners are likely to build a closer relationship, while the fact that it is delivered in a Children’s Centre increases the likelihood that onward service use is a result of signposting or referrals.
| Service | Number of Families Using Service | Linkage Rate | Number of Linked Families |
|---|---|---|---|
| Breastfeeding Peer Support | 2,946 | 16.7% | 493 |
| Speech and Language – Evelina Award | 993 | 40.6% | 403 |
| CE events and activities | 1,371 | 29.1% | 399 |
| CAN (Community Activity and Nutrition) | 734 | 45.4% | 333 |
| Natural Thinkers – Stay and Play | 1,435 | 21.1% | 303 |
| Baby Steps | 552 | 53.8% | 297 |
| Oral Health – Supervised Toothbrushing | 770 | 34.7% | 267 |
| Natural Thinkers | 651 | 38.7% | 252 |
| Healthy Living Platform | 690 | 29.7% | 205 |
| Speech and Language – Chattertime | 404 | 36.4% | 147 |
| Making it REAL | 350 | 39.7% | 139 |
| Overcrowded Housing | 168 | 43.5% | 73 |
| Parent Champions – Volunteers | 150 | 47.3% | 71 |
| PAIRS – One-to-One | 170 | 40.6% | 69 |
| Sharing REAL with Parents | 169 | 37.3% | 63 |
| PINE (Pregnancy Information for Nutrition and Exercise) | 156 | 39.1% | 61 |
| Circle of Security Parenting | 169 | 33.7% | 57 |
| Domestic Abuse – Enhanced Casework | 180 | 31.1% | 56 |
| Family Nutrition – HENRY | 138 | 37.7% | 52 |
| EPEC – Baby and Us | 81 | 60.5% | 49 |
| PAIRS – Together Time | 109 | 42.2% | 46 |
| Supporting Babies’ Next Steps | 84 | 50.0% | 42 |
| Caseload Midwifery | 85 | 42.4% | 36 |
| CoCreate Fund | 70 | 34.3% | 24 |
| EPEC – Being a Parent | 80 | 23.8% | 19 |
| Doorstep Library | 61 | 21.3% | 13 |
All else being equal, service linkage rates may also be influenced by the ages of the children. For instance, some of the services with the highest linkage rates, such as Caseload Midwifery and Community Activity and Nutrition, are accessed by families during pregnancy.
This puts these families at the ‘beginning’ of the LEAP programme with a larger variety of possible services to engage with as their child grows. In contrast, services for older children such as Natural Thinkers are less likely to have very high linkage rates because they represent the ‘ending’ of the LEAP programme in terms of child age and the early years focus of the programme.
Services with lower linkage rates such as Domestic Abuse – Enhanced Casework, and PAIRS one-to-one are LEAP’s more specialist services. The nature of the bespoke and intense support families receive in these services could reduce the likelihood that they will be signposted to another service to meet their needs.
The variety of possible interpretations of linkage rates and volumes speaks to the complexity of the LEAP programme and the range of types of services that families can access.
Service pathways
As noted earlier, more than 1 in 4 families engage with at least two services, and about 9.8% of families engage with at least three services. Figure 37 highlights the most common pathways of multiple service use that consist of two services.
Relatively low numbers of families who access more than two services makes it hard to generalise and present longer pathways with any certainty that they are meaningful for LEAP as a programme rather than being illustrative of the idiosyncratic needs of families.
When looking at links between services, it was possible to identify the most common collection of pathways or combinations of services that families had accessed. Figure 37 shows a sample of service connections representing more than 35% of all service linkages between LEAP services:
- Settings based services
In Figure 37, the left-hand collection of pathways shows strong links between Natural Thinkers, Speech and Language Evelina Award and Supervised Toothbrushing. These services are all based at and run through local early years settings. Many of these settings have implemented multiple LEAP services at the same time, meaning that children will likely engage with multiple services whilst spending time at the setting they are enrolled at. - Perinatal services
In Figure 37, the right-hand collection of pathways shows strong links between LEAP’s Community Activity and Nutrition (CAN), Baby Steps and Breastfeeding Peer Support. These services are all accessed by families during the perinatal period and work to refer and signpost families between each other as a pregnancy and baby develops. - Universal borough-wide services
In Figure 37, the right-hand network of pathways shows families frequently attending Community Engagement events or activities as well as the Healthy Living Platform. There is also a strong pathway between these two points and Natural Thinkers – Stay and Play. All three of these services are universally accessible to local families and are more likely to be used by non-LEAP area families compared to LEAP’s targeted or specialist services.
18.4 Conclusions
Findings show that course-style LEAP services have been successful at retaining families for at least enough sessions for families to achieve dosage , which is the level of engagement after which a service would expect to have made an impact on participants outcomes.
It is less common for families to complete a service, although this was the case for over a quarter of families who can be considered to have received the full benefits of the service as a result.
Over 1 in 4 families access multiple LEAP services, and analysis shows that a higher proportion of families from LEAP’s priority population engaged with multiple services, compared with families not from the priority population.
This is an important success for the LEAP programme, as families with the characteristics of LEAP’s priority population are typically less likely to engage with early years services, for a variety of reasons, and are often those most likely to benefit from sustained engagement with multiple mutually-reinforcing services.
Looking at the patterns of multiple service use in our data, there are at some lessons to be learned about service linkages. Firstly, and unsurprisingly, services universally accessible to local families, regardless of whether they live in the LEAP area or not, are commonly accessed.
Secondly, place and setting matter – some of the most common pathways of multiple service use in our network are those between services that are delivered at the same location, specifically those services we have embedded and deliver through early years childcare settings.
Lastly, it seems that families are likely to benefit from and utilise a network of services that address broadly similar areas of need, such as the parenting and perinatal services.
The strength of this pathway reflects both the timeliness and relevance of these of services to families in pregnancy and the post-natal period, as well as the work that has gone in to strengthening relationships between service delivery teams to support referrals and signposting.
19.0 Overall Conclusions
This report presents an in-depth analysis of who has engaged with LEAP services and activities, and how families have engaged. As LEAP enters its final phase, we are pleased to have exceeded our early goal of reaching 10,000 local children.
Against the background of declining uptake of early years offers, the challenges of COVID-19 and the cost-of-living crisis as well as evidence that groups like LEAP’s priority population are least likely to access early years services, the extent of our reach, and the findings that those engaged are representative of our priority population is a significant achievement.
We are also pleased to show the specific contribution of our Community Engagement programme in both the initial and sustained engagement of local families, particularly those from our priority population. This report provides some evidence that working with communities in this way is a valuable and effective approach to supporting the uptake and continued engagement with services.
Families continue to rate LEAP services very highly, with feedback data being consistently positive.
LEAP services are set up to operate primarily within the LEAP area and to be welcoming and accessible to the local community. Feedback data, alongside the findings from engagement data, suggests that this approach has been successful.
Retention of families once engaged with a service was good. Over two thirds of course-style-service participants attend a minimum number of sessions to achieve dosage, where the service is expected to have made some impact, and over one third completed the course and will have been able to benefit fully from the service.
Medium term outcomes data illustrates that most parents felt services were supporting improvements in their knowledge and confidence around supporting their child’s early development.
As a collective impact initiative, it is encouraging to see that 1 in 4 families attended multiple LEAP services over the course of the programme. Analysis of multiple service use data revealed some strong links between particular groups of services.
The most common pathways suggest that families will be more likely to attend several services if they are delivered from the same setting, if they are universally accessible and if they cluster around a particular need with particularly strong pathways in perinatal services that offer support from pregnancy to the post-natal period.
More research could be done into the patterns of multiple service use, LEAP is unable to directly monitor referrals or signposting which could provide a much deeper understanding. However, these findings provide initial patterns of interest to anyone working in a collective impact, or place-based programme.
The themes highlighted throughout the report about the barriers and enablers to family engagement provide insight into the day-to-day approaches being used by LEAP to address these barriers, engage and keep families engaged with services.
Based on the other evidence presented here, we feel confident that these approaches have been working to support engagement with families and will provide valuable insight for programmes and service providers in other areas and contexts.
20.0 Appendix A : Acronyms and abbreviations
| ABS | A Better Start |
| CAN | Community Activity and Nutrition |
| CE | Community Engagement |
| CLD | Communication and Language Development |
| COSP | Circle of Security Parenting |
| EAL | English as an Additional Language |
| EPEC | Empowering Parents, Empowering Communities |
| HLP | Healthy Living Platform |
| HV | Health Visiting |
| IMD | Indices of Multiple Deprivation |
| LEAP | Lambeth Early Action Partnership |
| NCB | National Children’s Bureau |
| PAIRS | Parent and Infant Relationship Service |
| PINE | Pregnancy Information for Nutrition and Exercise |
| REAL | Raising Early Achievement in Literacy |
| the platform | Data Integration Platform |
21.0 Appendix B: Methodology
21.1 Quantitative data
Defining Family Demographic Variables
Deriving family-level demographic variables using individual-level data
Family-level variables identifying priority population status, local IMD quintile, and area of residence follow a hierarchical approach within each family. The hierarchy prioritises using first the information about children in the family, then the mother’s information if possible, then the father’s if possible, and finally any other family members.
This approach first looks at all the children in a family and assigns a value to the family-level variable using the children’s information if there is a clear value to assign.
For example, when looking at area, individuals can reside in the LEAP area, the non-LEAP area, or have an unknown value. A family that has two children is considered in the LEAP area if at least one of the children resides in the LEAP area. If both children reside in the non-LEAP area, then the family will be classified as residing in the non-LEAP area.
However, if only one child resides in the non-LEAP area and the other has unknown area information, then the hierarchy progresses to the mother level, because the child-level alone does not definitely determine a family-level value of “LEAP area” or “non-LEAP area.”
The same procedure is then applied to each higher level in the hierarchy until a definite value is given to the family, including a value of “unknown” if other values cannot be definitively determined.
For family-level ethnicity, families are classified as “mixed or multiple ethnicities” if two or more individuals in the family have known, different ethnicities. Otherwise, if everyone in the family that has a known ethnicity also has the same ethnicity, the family is considered that ethnicity.
If everyone in the family has an unknown ethnicity, then the family ethnicity is unknown. This is functionally the same as following the hierarchy outlined above, with the exception that it may underestimate the number of mixed-ethnicity families. This decision was made to account for relatively high rates of missing ethnicity data at the individual level.
For family-level EAL status, a family is classified as an EAL family if anyone in the family is known to have English as an additional language.
For parent age, the age of the mother was used wherever possible, then the age of the father, and then the age of the other non-child family members. In cases where there were multiple members of a category (i.e. two mothers), the age of the earliest LEAP registrant in the category was taken.
21.2 Qualitative data
Barriers and Enablers to family engagement
To build an understanding of some of the drivers of the patterns of family engagement with LEAP, we conducted seven qualitative interviews with core team members responsible for service management and delivery across the LEAP programme.
Interviews were semi-structured, broadly following a core set of questions but with space for discussion of other relevant topics. Interviews took place over Microsoft Teams, and notes were taken during the interviews on a collaborative Miro Board. Interview participants had the opportunity to review these notes before they were analysed.
Thematic analysis of the notes was carried out by LEAP’s senior researcher, and themes were then sense checked with interview participants, and a wider group of LEAP team members. Limitations of this research was that specific service providers and practitioners were not interviewed, however the LEAP team members who did participate have a detailed understanding of the engagement approaches and experiences of services.
Feedback data
Throughout the report, but particularly within section 14 quotes from open-text responses to the Family Feedback Form are used where possible to illustrate, explain and expand on themes raised by the quantitative analysis. Open text responses from the Family Feedback Form were uploaded onto NVivo, coded, then grouped into themes.
The quotes included in the report were chosen because they were reflective of the key themes and also represented a range of services and participant experiences. Quotes are given verbatim to preserve the voice of the original respondent.
22.0 Appendix C: List of Figures
| Figure | Name | Page |
|---|---|---|
| A | LEAP’s programme Theory of Change | 7 |
| B | Number of LEAP participants by year and area | 8 |
| C | Children under 5-years-old living in the LEAP area by engagement status and priority population status | 9 |
| D | Average number of sessions attended per LEAP service engaged with by family’s first point of engagement (n = 7,903) | 10 |
| E | Overall feedback from parents and carers who used LEAP services | 10 |
| F | Multiple LEAP service use rates by priority population status (n = 7,394) | 12 |
| G | Most common service use pathways for families who used multiple services | 12 |
| Figure | Name | Page |
|---|---|---|
| 1 | The LEAP area | 17 |
| 2 | LEAP’s programme Theory of Change | 18 |
| 3 | Number of LEAP participants by family role and area | 21 |
| 4 | Number of LEAP participants by year and area | 22 |
| 5 | Calculation of LEAP’s priority population | 24 |
| 6 | Data flow for health visiting data | 25 |
| 7 | Children under 5-years-old living in the LEAP area by engagement status and priority population status | 25 |
| 8 | Ethnicity of families by area and LEAP engagement status, compared to wider Lambeth population (LEAP-engaged n = 7,067) | 28 |
| 9 | Local IMD quintile of families engaged with LEAP by area (n = 4,864) | 29 |
| 10 | Percentage of families engaged, service enrolments, and session/activity attendances by area | 30 |
| 11 | Percentage of families engaged with LEAP by first point of engagement (n = 8,800) | 34 |
| 12 | Percentage of families engaged with LEAP by first point of engagement and priority population status (n = 8,138) | 35 |
| 13 | Percentage of families engaged with LEAP by first point of engagement and EAL status (n = 7,084) | 35 |
| 14 | Percentage of families who first engaged through Community Engagement by continued engagement with LEAP services (n = 1,167) | 36 |
| 15 | Percentage of families who first engaged through Community Engagement by continued engagement with LEAP services and priority population status (n = 1,013) | 36 |
| 16 | Percentage of families who first engaged through Community Engagement by continued engagement with LEAP services and ethnicity (n = 856) | 37 |
| 17 | Average number of LEAP services engaged with by family’s first point of engagement (n = 7,903) | 38 |
| 18 | Average number of sessions attended per LEAP service engaged with by family’s first point of engagement (n = 7,903) | 38 |
| 19 | Overall feedback from parents and carers who used LEAP services | 42 |
| 20 | Family feedback: ‘I learnt something new because of attending this service’, by IMD quintile | 43 |
| 21 | Participant responses about how attending Baby Steps or Circle of Security Parenting affected their knowledge and confidence as parents | 49 |
| 22 | Participants’ responses to the statement ‘I feel anxious about being a parent’ | 50 |
| 23 | Participant responses about how attending Supporting Babies’ Next Steps or Sharing REAL with Parents affected their knowledge about early communication, language and literacy development | 51 |
| 24 | Participant responses about how attending Supporting Babies’ Next Steps or Sharing REAL with Parents affected their confidence in supporting their baby’s/child’s early communication, language and literacy development | 51 |
| 25 | Participant responses about how attending Supporting Babies’ Next Steps or Sharing REAL affected their knowledge and confidence about early communication, language and literacy development, by EAL status | 52 |
| 26 | Participant responses about how attending Making it REAL affected their knowledge about early literacy (n = 44) | 53 |
| 27 | Participant responses about how attending Making it REAL affected their confidence in supporting their child’s literacy development (n = 44) | 53 |
| 28 | Effect of attending Natural Thinkers – Stay and Play sessions on children’s communication and language (n = 65) | 54 |
| 29 | Effect of attending Natural Thinkers – Stay and Play sessions on children’s health and wellbeing (n = 65) | 54 |
| 30 | Effect of attending CAN on participants’ knowledge about healthy lifestyles (n = 70) | 55 |
| 31 | Effect of attending CAN on participants’ intention to make healthier choices (n = 70) | 56 |
| 32 | Dosage and completion rates across all course-style services by priority population status (n = 1,371) | 61 |
| 33 | Overall multiple LEAP service use rates (n = 7,905) | 61 |
| 34 | Multiple LEAP service use rates by priority population status (n = 7,394) | 62 |
| 35 | Multiple LEAP service use rates by ethnicity (n = 6,762) | 62 |
| 36 | Multiple LEAP service use rates by area (n = 7,420) | 63 |
| 37 | Most common service use pathways for families who used multiple services | 65 |
| Table | Title | Page |
|---|---|---|
| 1 | Percentage of families engaged with services, by area | 30/31 |
| 2 | Dosage and completion thresholds for LEAP’s course-style services | 59/60 |
| 3 | Linkage rates between LEAP services and events, including Community Engagement | 63/64 |